Rank
Learn which of two videos contains the more severe physical violation.
Evaluating the physical consistency of generated videos remains a fundamental challenge. Existing approaches rely on off-the-shelf vision-language models, which can be myopic to physical dynamics, or fine-tuned evaluators that can overfit to dataset-specific cues. We introduce PhyProbe, an evaluator that extracts features from a frozen pretrained spatiotemporal encoder and maps them to a scalar physical-consistency violation score through a lightweight scoring head. Higher scores indicate more severe physical violations, while lower scores indicate greater physical consistency. PhyProbe is trained with a unified objective combining pairwise ranking, regression on noisy scalar annotations, and score anchoring over heterogeneous supervision sources. Across real–generated and generated–generated benchmarks, PhyProbe reliably orders videos and anchors its scores to a stable reference scale. Although it receives no explicit general-preference labels, it also transfers competitively to broader human preference benchmarks.
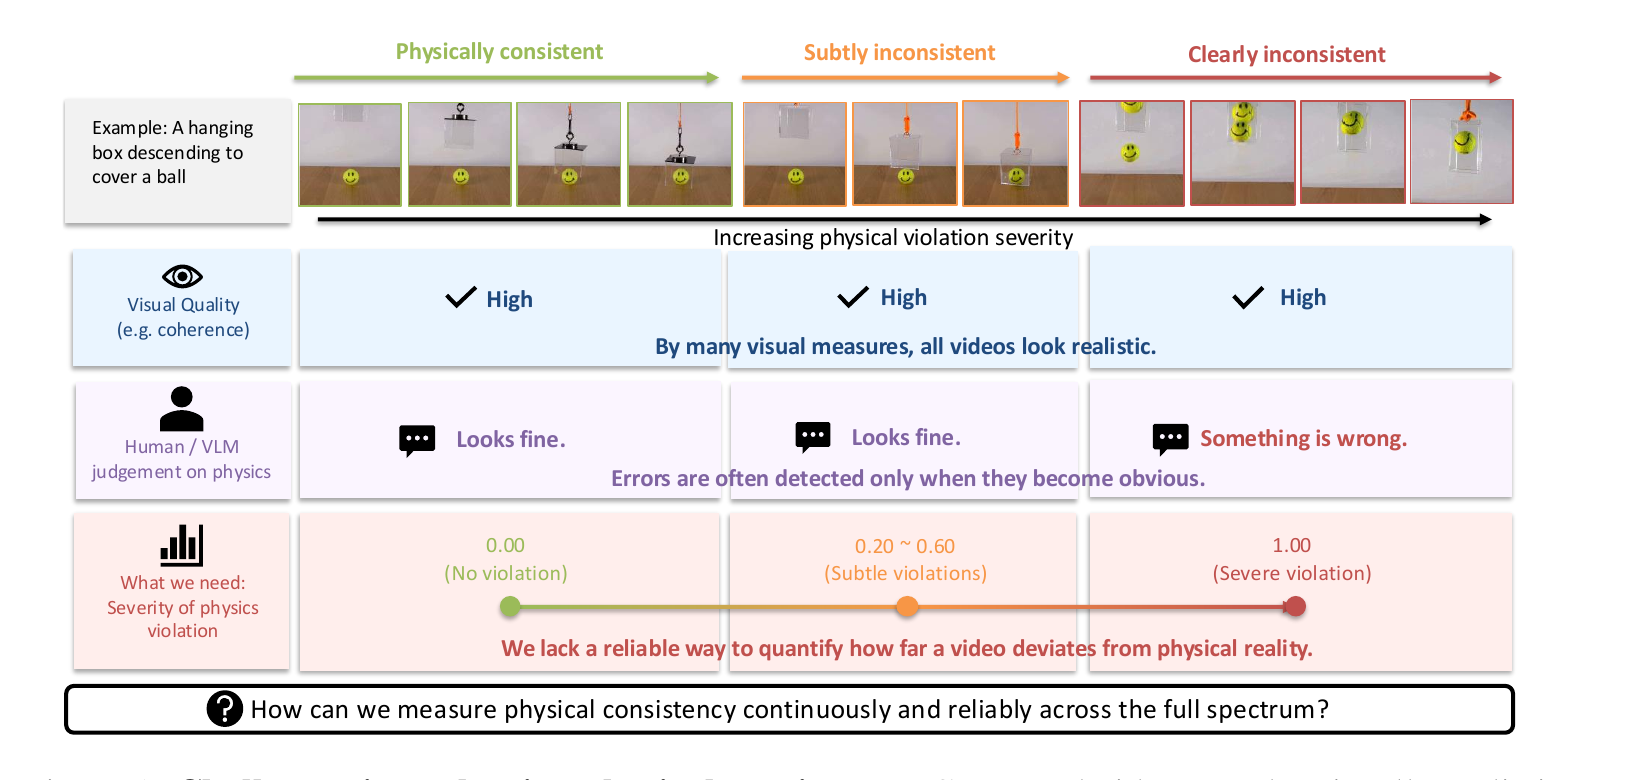
A video can look sharp and temporally coherent while still violating the dynamics of the physical world. PhyProbe treats physical consistency as a measurement problem: instead of only deciding whether something is wrong, it estimates how severe the violation is on a continuous scale anchored by real videos and clear failures.
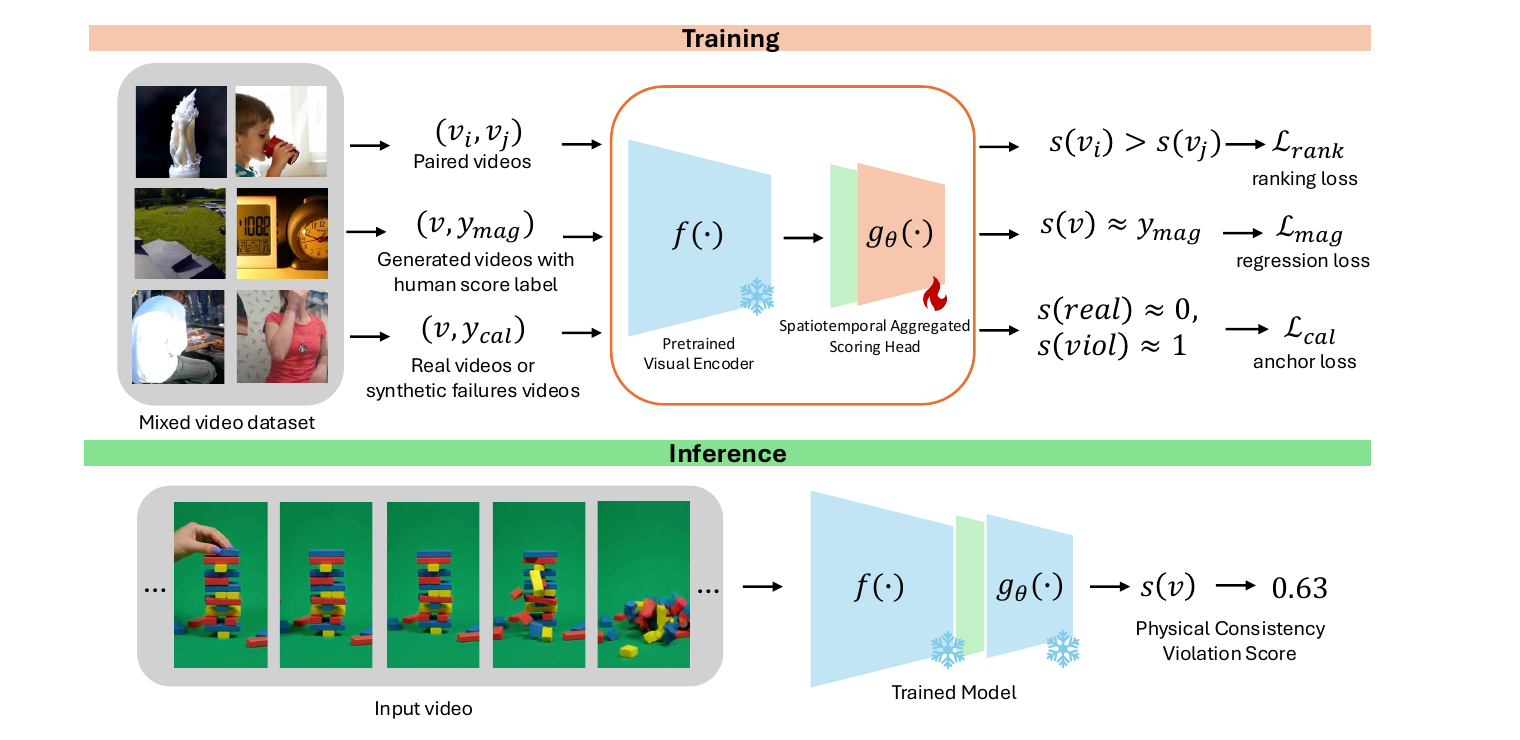
PhyProbe uses a frozen 2B-parameter spatiotemporal visual encoder and trains only a lightweight 1M-parameter scoring head. Three complementary signals shape the score: pairwise rankings provide stable relative order, noisy human ratings provide approximate magnitude, and reference anchors map real videos near 0 and clear violations near 1. At inference time, the model needs only a single video—no prompt or reference pair.
Learn which of two videos contains the more severe physical violation.
Use scalar human ratings to ground relative order in approximate magnitude.
Use targets of 0 for real videos and 1 for clear synthetic failures to anchor the score scale.
PhyProbe achieves the best weighted average and leads on three of four physical-consistency benchmarks. Its largest gains appear in real–generated and no-correspondence settings, while Gemini-3.1-Pro leads on VideoPhy2.
Pair types: R–G compares a real video with a generated video; G–G compares two generated videos.
Correspondence: image+text pairs share an input image and text prompt; text pairs share a prompt; no-correspondence pairs require neither.
| Method | ImplBR–G | VP2G–G | PhyDetExR–G | VF2G–G | Avg. |
|---|---|---|---|---|---|
| VideoPhy2-AutoEval | 28.0 | 28.5 | 30.5 | 36.3 | 32.1 |
| V-JEPA2 Surprise | 33.3 | 46.3 | 49.0 | 45.5 | 46.6 |
| VideoScore2 | 68.7 | 49.7 | 60.6 | 65.0 | 59.9 |
| Gemini-3.1-Flash-Lite | 91.3 | 61.8 | 89.0 | 74.5 | 77.3 |
| Gemini-3.1-Pro | 95.2 | 70.5 | 86.2 | 73.7 | 78.1 |
| PhyProbe | 98.0 | 66.1 | 98.9 | 75.2 | 82.4 |
Pairwise accuracy (%). Higher is better. Avg. is weighted by benchmark pair count; the best result in each column is highlighted.
Evaluation settings: ImplausiBench[1] (image+text, R–G) · VideoPhy2[2] (text, G–G) · PhyDetEx[3] (no correspondence, R–G) · VideoFeedback2[4] (no correspondence, G–G).
We compare PhyProbe with human ratings after aligning the score direction so that higher means more physically plausible. Correlation ranges from −1 to 1: values closer to 1 indicate stronger agreement, while values near 0 indicate little linear agreement (Pearson) or rank agreement (Spearman).
| Method | VideoPhy2 | VideoFeedback2 | Average | |||
|---|---|---|---|---|---|---|
| ρ | r | ρ | r | ρ | r | |
| VideoPhy2-AutoEval | 0.359 | 0.362 | 0.235 | 0.240 | 0.298 | 0.302 |
| V-JEPA2 Surprise | 0.065 | 0.065 | 0.121 | 0.133 | 0.093 | 0.099 |
| VideoScore2 | 0.197 | 0.160 | 0.462 | 0.430 | 0.336 | 0.301 |
| Gemini-3.1-Flash-Lite | 0.302 | 0.303 | 0.419 | 0.409 | 0.362 | 0.357 |
| Gemini-3.1-Pro | 0.277 | 0.240 | 0.402 | 0.383 | 0.341 | 0.313 |
| PhyProbe | 0.293 | 0.302 | 0.596 | 0.604 | 0.458 | 0.466 |
Takeaway: VideoPhy2-AutoEval is strongest on its in-domain VideoPhy2 benchmark, but its correlation falls substantially on VideoFeedback2. PhyProbe is moderate on VideoPhy2, strongest on VideoFeedback2, and achieves the best cross-dataset average. Average correlations use an equal-weight Fisher-z aggregation.
To isolate the contribution of PhyProbe's learning objective, we compare it with V-JEPA2 Surprise using the identical frozen V-JEPA2 ViT-H/16 backbone. PhyProbe improves both pairwise accuracy and human-rating correlation, showing that the gains do not come from the backbone alone.
| Method | ImplB | VideoPhy2 | PhyDetEx | VideoFeedback2 |
|---|---|---|---|---|
| V-JEPA2 Surprise | 33.3 | 46.3 | 49.0 | 45.5 |
| PhyProbe | 81.4 | 60.2 | 70.7 | 76.3 |
| Improvement | +48.1 | +13.9 | +21.7 | +30.8 |
| Method | VideoPhy2 | VideoFeedback2 | ||
|---|---|---|---|---|
| ρ | r | ρ | r | |
| V-JEPA2 Surprise | 0.065 | 0.065 | 0.121 | 0.133 |
| PhyProbe | 0.301 | 0.303 | 0.623 | 0.630 |
| Improvement | +0.236 | +0.238 | +0.502 | +0.497 |
Controlled comparison: both methods use V-JEPA2 ViT-H/16. The main results above use PhyProbe with PE-Core-G14-448. Accuracy improvements are in percentage points.
PhyProbe assigns more distinct scores to plausible and implausible videos than VideoPhy2-AutoEval. AUC measures how reliably the score separates the two groups (0.5 is chance; 1.0 is perfect), while a larger Cohen's d indicates a wider gap between their score distributions. VideoFeedback2 results here use only the clearly implausible and plausible endpoints (human ratings 1 and 5), rather than the full rating range used in the correlation table.
| Method | ImplausiBench | VideoFeedback2 | ||
|---|---|---|---|---|
| AUC | Cohen's d | AUC | Cohen's d | |
| VideoPhy2-AutoEval | 0.587 | 0.34 | 0.667 | 0.74 |
| PhyProbe | 0.868 | 1.60 | 0.980 | 3.26 |
Although trained without explicit general-preference labels, PhyProbe also transfers to broader video preference benchmarks: MonetBench[5], Rapidata-I2V[6][7], and VideoGen-RewardBench[8]. This suggests that physical failures are an important component of perceived video quality rather than an isolated artifact category.
| Method | With ties | Without ties |
|---|---|---|
| Random | 33.2 | 49.9 |
| V-JEPA2 Surprise | 52.4 | 53.8 |
| VideoScore2 | 42.3 | 41.1 |
| VideoPhy2-AutoEval | 22.5 | 16.5 |
| VisionReward | 68.2 | 72.2 |
| VideoReward | 56.1 | 58.2 |
| PhyProbe | 72.7 | 71.0 |
| Method | Accuracy (%) |
|---|---|
| Random | 49.7 |
| V-JEPA2 Surprise | 45.1 |
| VideoScore2 | 45.8 |
| VideoPhy2-AutoEval | 9.5 |
| VisionReward | 47.1 |
| VideoReward | 51.5 |
| PhyProbe | 62.7 |
| Method | Overall | Motion | Visual | |||
|---|---|---|---|---|---|---|
| ties | no ties | ties | no ties | ties | no ties | |
| Random | 33.2 | 49.7 | 33.2 | 49.5 | 33.3 | 49.8 |
| V-JEPA2 Surprise | 45.2 | 44.2 | 48.8 | 47.1 | 48.7 | 47.6 |
| VideoScore2 | 57.4 | 58.9 | 54.3 | 60.6 | 55.3 | 60.1 |
| VideoPhy2-AutoEval | 24.6 | 19.5 | 37.9 | 20.5 | 34.4 | 20.4 |
| VisionReward | 64.6 | 67.6 | 54.6 | 61.3 | 54.8 | 59.1 |
| VideoReward | 69.7 | 73.6 | 60.3 | 75.2 | 63.6 | 75.9 |
| PhyProbe | 64.1 | 65.3 | 62.3 | 65.9 | 61.4 | 63.2 |
Pairwise accuracy (%). Higher is better; the strongest result in each column is highlighted. For tie-aware evaluation, PhyProbe uses the 20th percentile of absolute score differences on each benchmark as its tie threshold. Without-tie results compare raw scores.
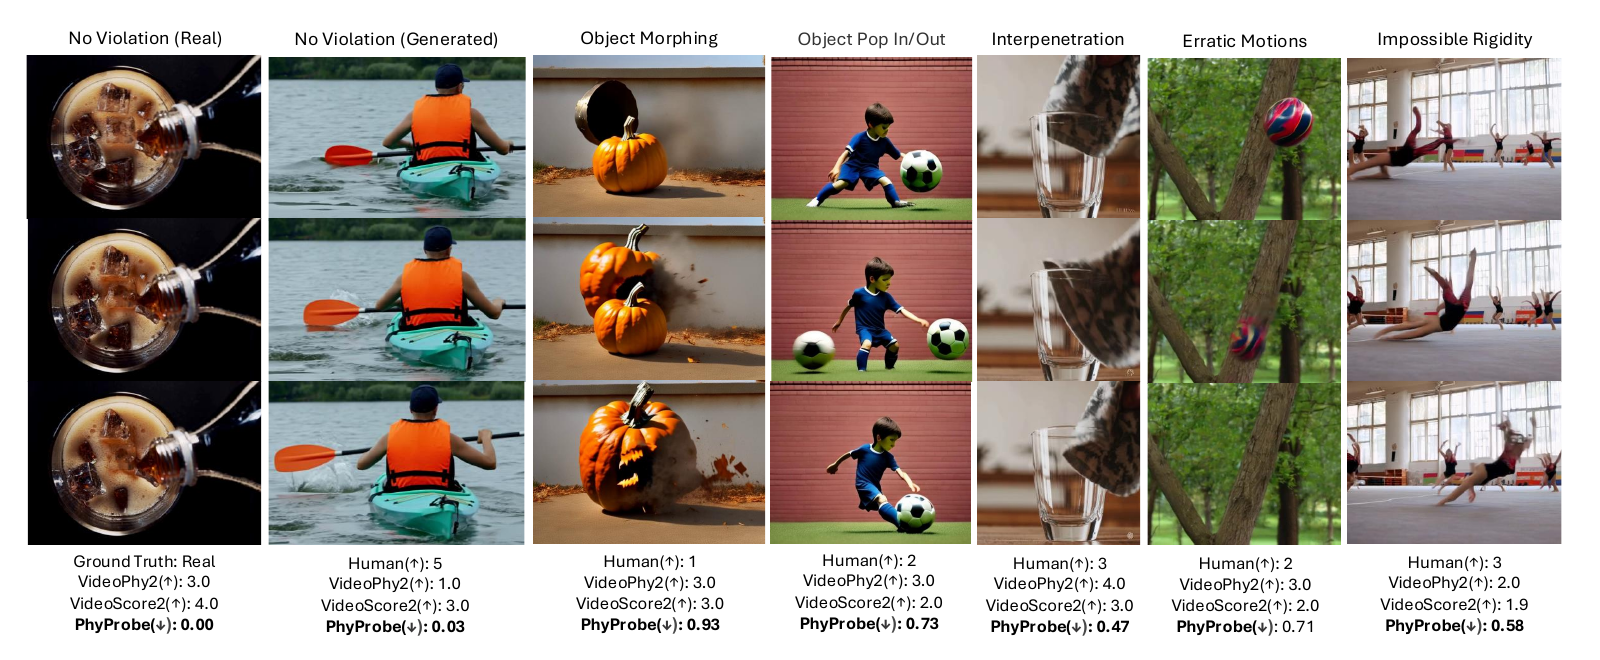
In these examples, coherent real and generated motion receives scores near zero, while morphing, object pop-in, interpenetration, erratic motion, and impossible rigidity receive higher violation scores.
@inproceedings{ku2026phyprobe,
  title   = {PhyProbe: Rethinking Physical Consistency Evaluation in Generated Videos},
  author  = {Ku, Max and Fan, Jiaojiao and Hao, Zekun and Ferroni, Francesco and Wang, Heng and Chen, Wenhu and Liu, Ming-Yu and Chattopadhyay, Prithvijit},
  booktitle = {Advances in Neural Information Processing Systems (NeurIPS)},
  year    = {2026},
  eprint  = {2609.38377},
  archivePrefix = {arXiv},
  url     = {https://arxiv.org/abs/2609.38377}
}