NVIDIA Research
Toronto AI Lab
NVIDIA Research
Toronto AI Lab
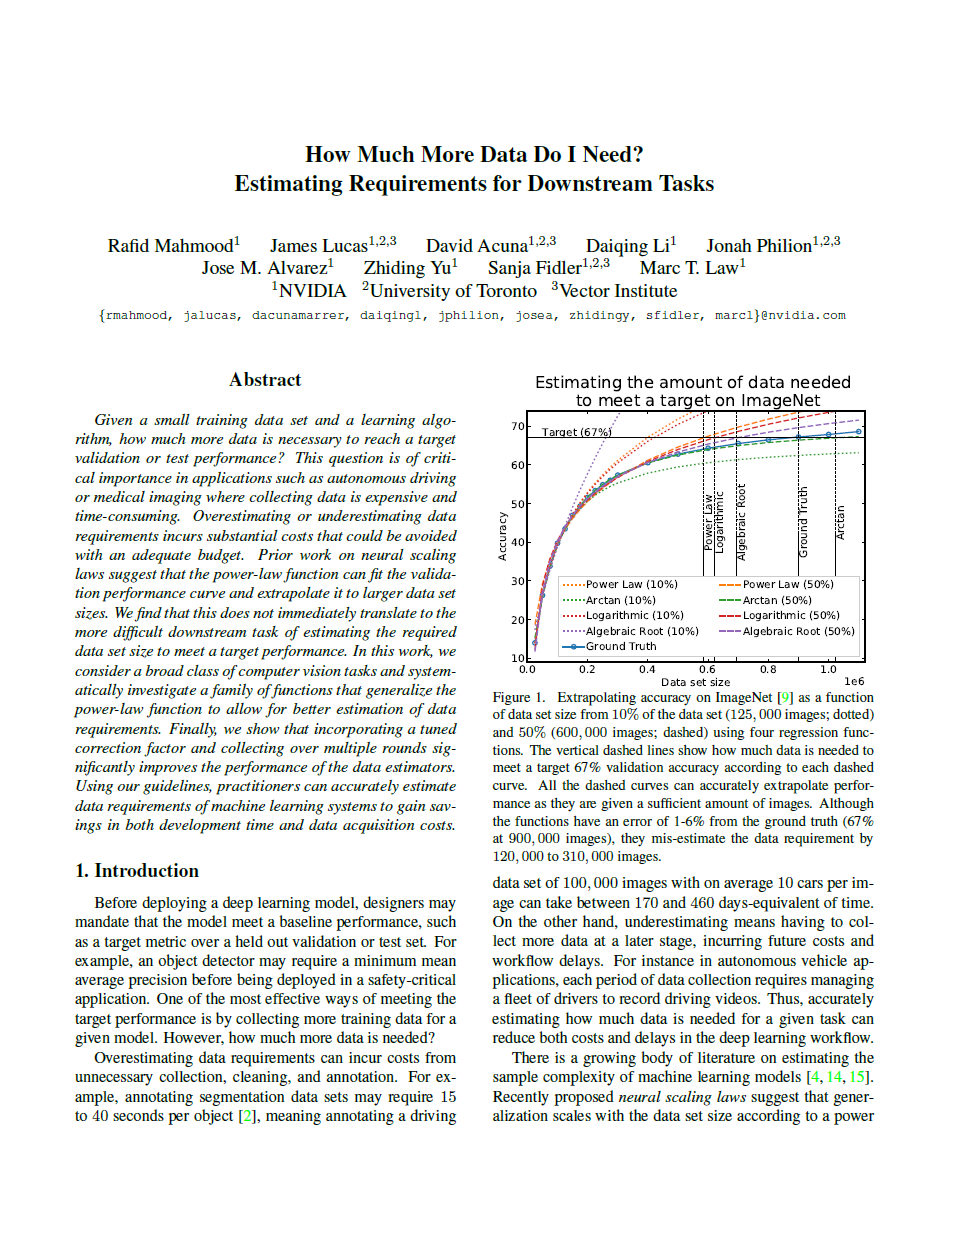
Given a small training data set and a learning algorithm, how much more data is necessary to reach a target validation or test performance? This question is of critical importance in applications such as autonomous driving or medical imaging where collecting data is expensive and time-consuming. Overestimating or underestimating data requirements incurs substantial costs that could be avoided with an adequate budget. Prior work on neural scaling laws suggest that the power-law function can fit the validation performance curve and extrapolate it to larger data set sizes. We find that this does not immediately translate to the more difficult downstream task of estimating the required data set size to meet a target performance. In this work, we consider a broad class of computer vision tasks and systematically investigate a family of functions that generalize the power-law function to allow for better estimation of data requirements. Finally, we show that incorporating a tuned correction factor and collecting over multiple rounds significantly improves the performance of the data estimators. Using our guidelines, practitioners can accurately estimate data requirements of machine learning systems to gain savings in both development time and data acquisition costs.
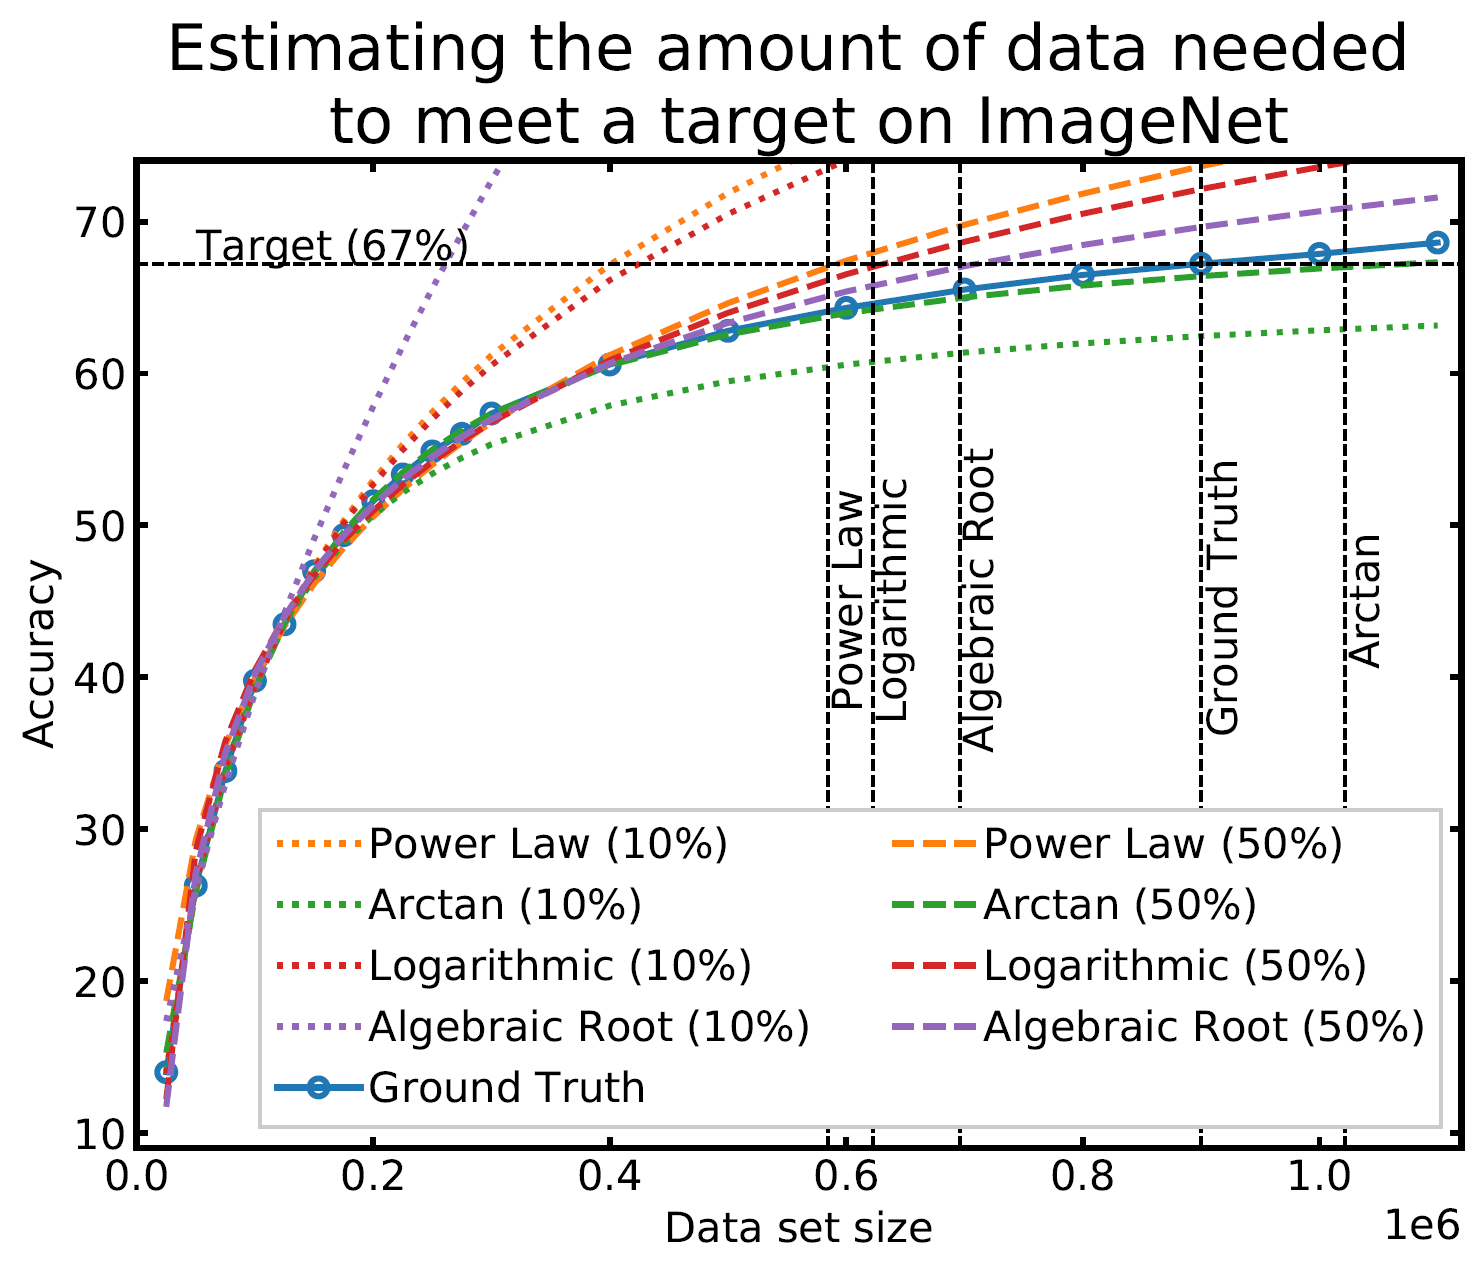
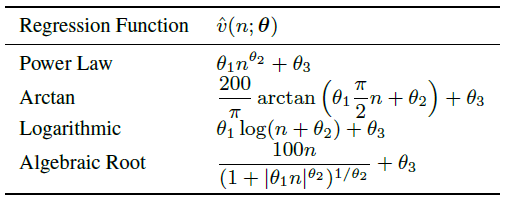
Extrapolating the learning curve (Left Figure) on ImageNet as a function of data set size when given 10% of the data set (125, 000 images; dotted curves) and 50% (600, 000 images; dashed curves) using four regression functions (Right Table). Vertical lines show how much data we need to meet a target 67% validation accuracy according to each dashed curve. (1) With a small initial set (i.e., 10%), all of the regression functions diverge from the ground truth learning curve. (2) With enough data (i.e., 50%), the functions accurate extrapolate performance. (3) Even a small extrapolation error can yield poor data estimates.
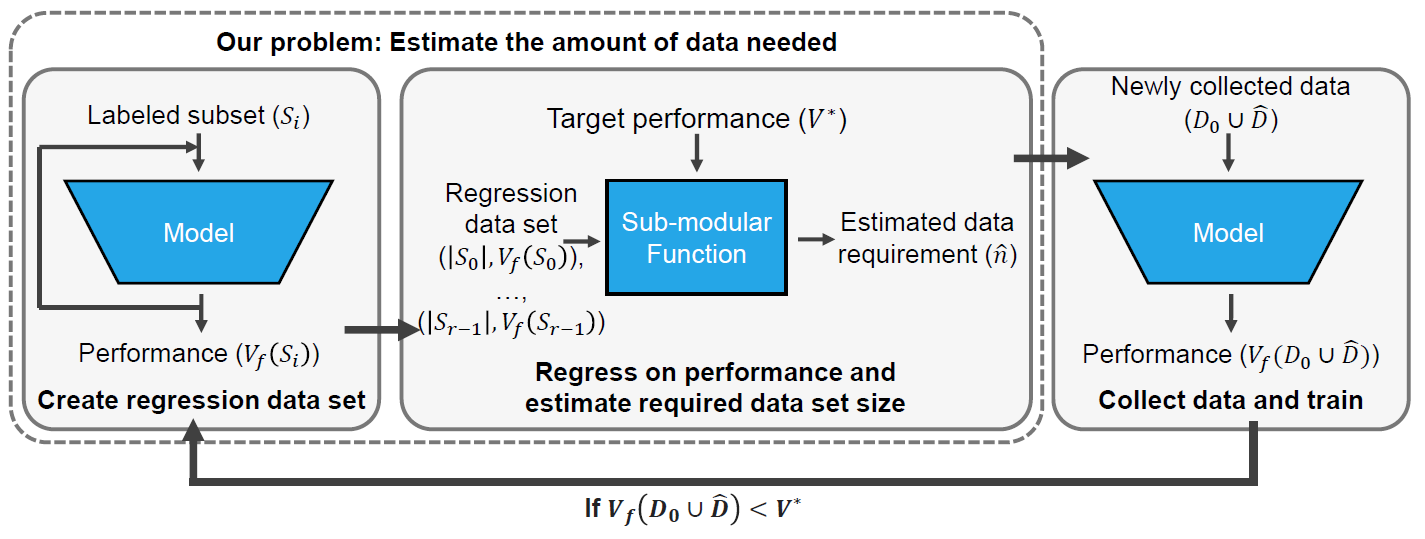
Given a target performance V*, initial set of points D0, and maximum number of collection rounds T, we first partition the data set into subsets Si, train our model, and evaluate the performance Vf(Si) with each subset. We use this set of training statistics to fit a submodular regression function that can extrapolate performance and thereby estimate how much data is needed to meet a target score. Finally, we collect this additional data, train our model, and evaluate the current performance. We repeat until we reach the target or after T rounds.
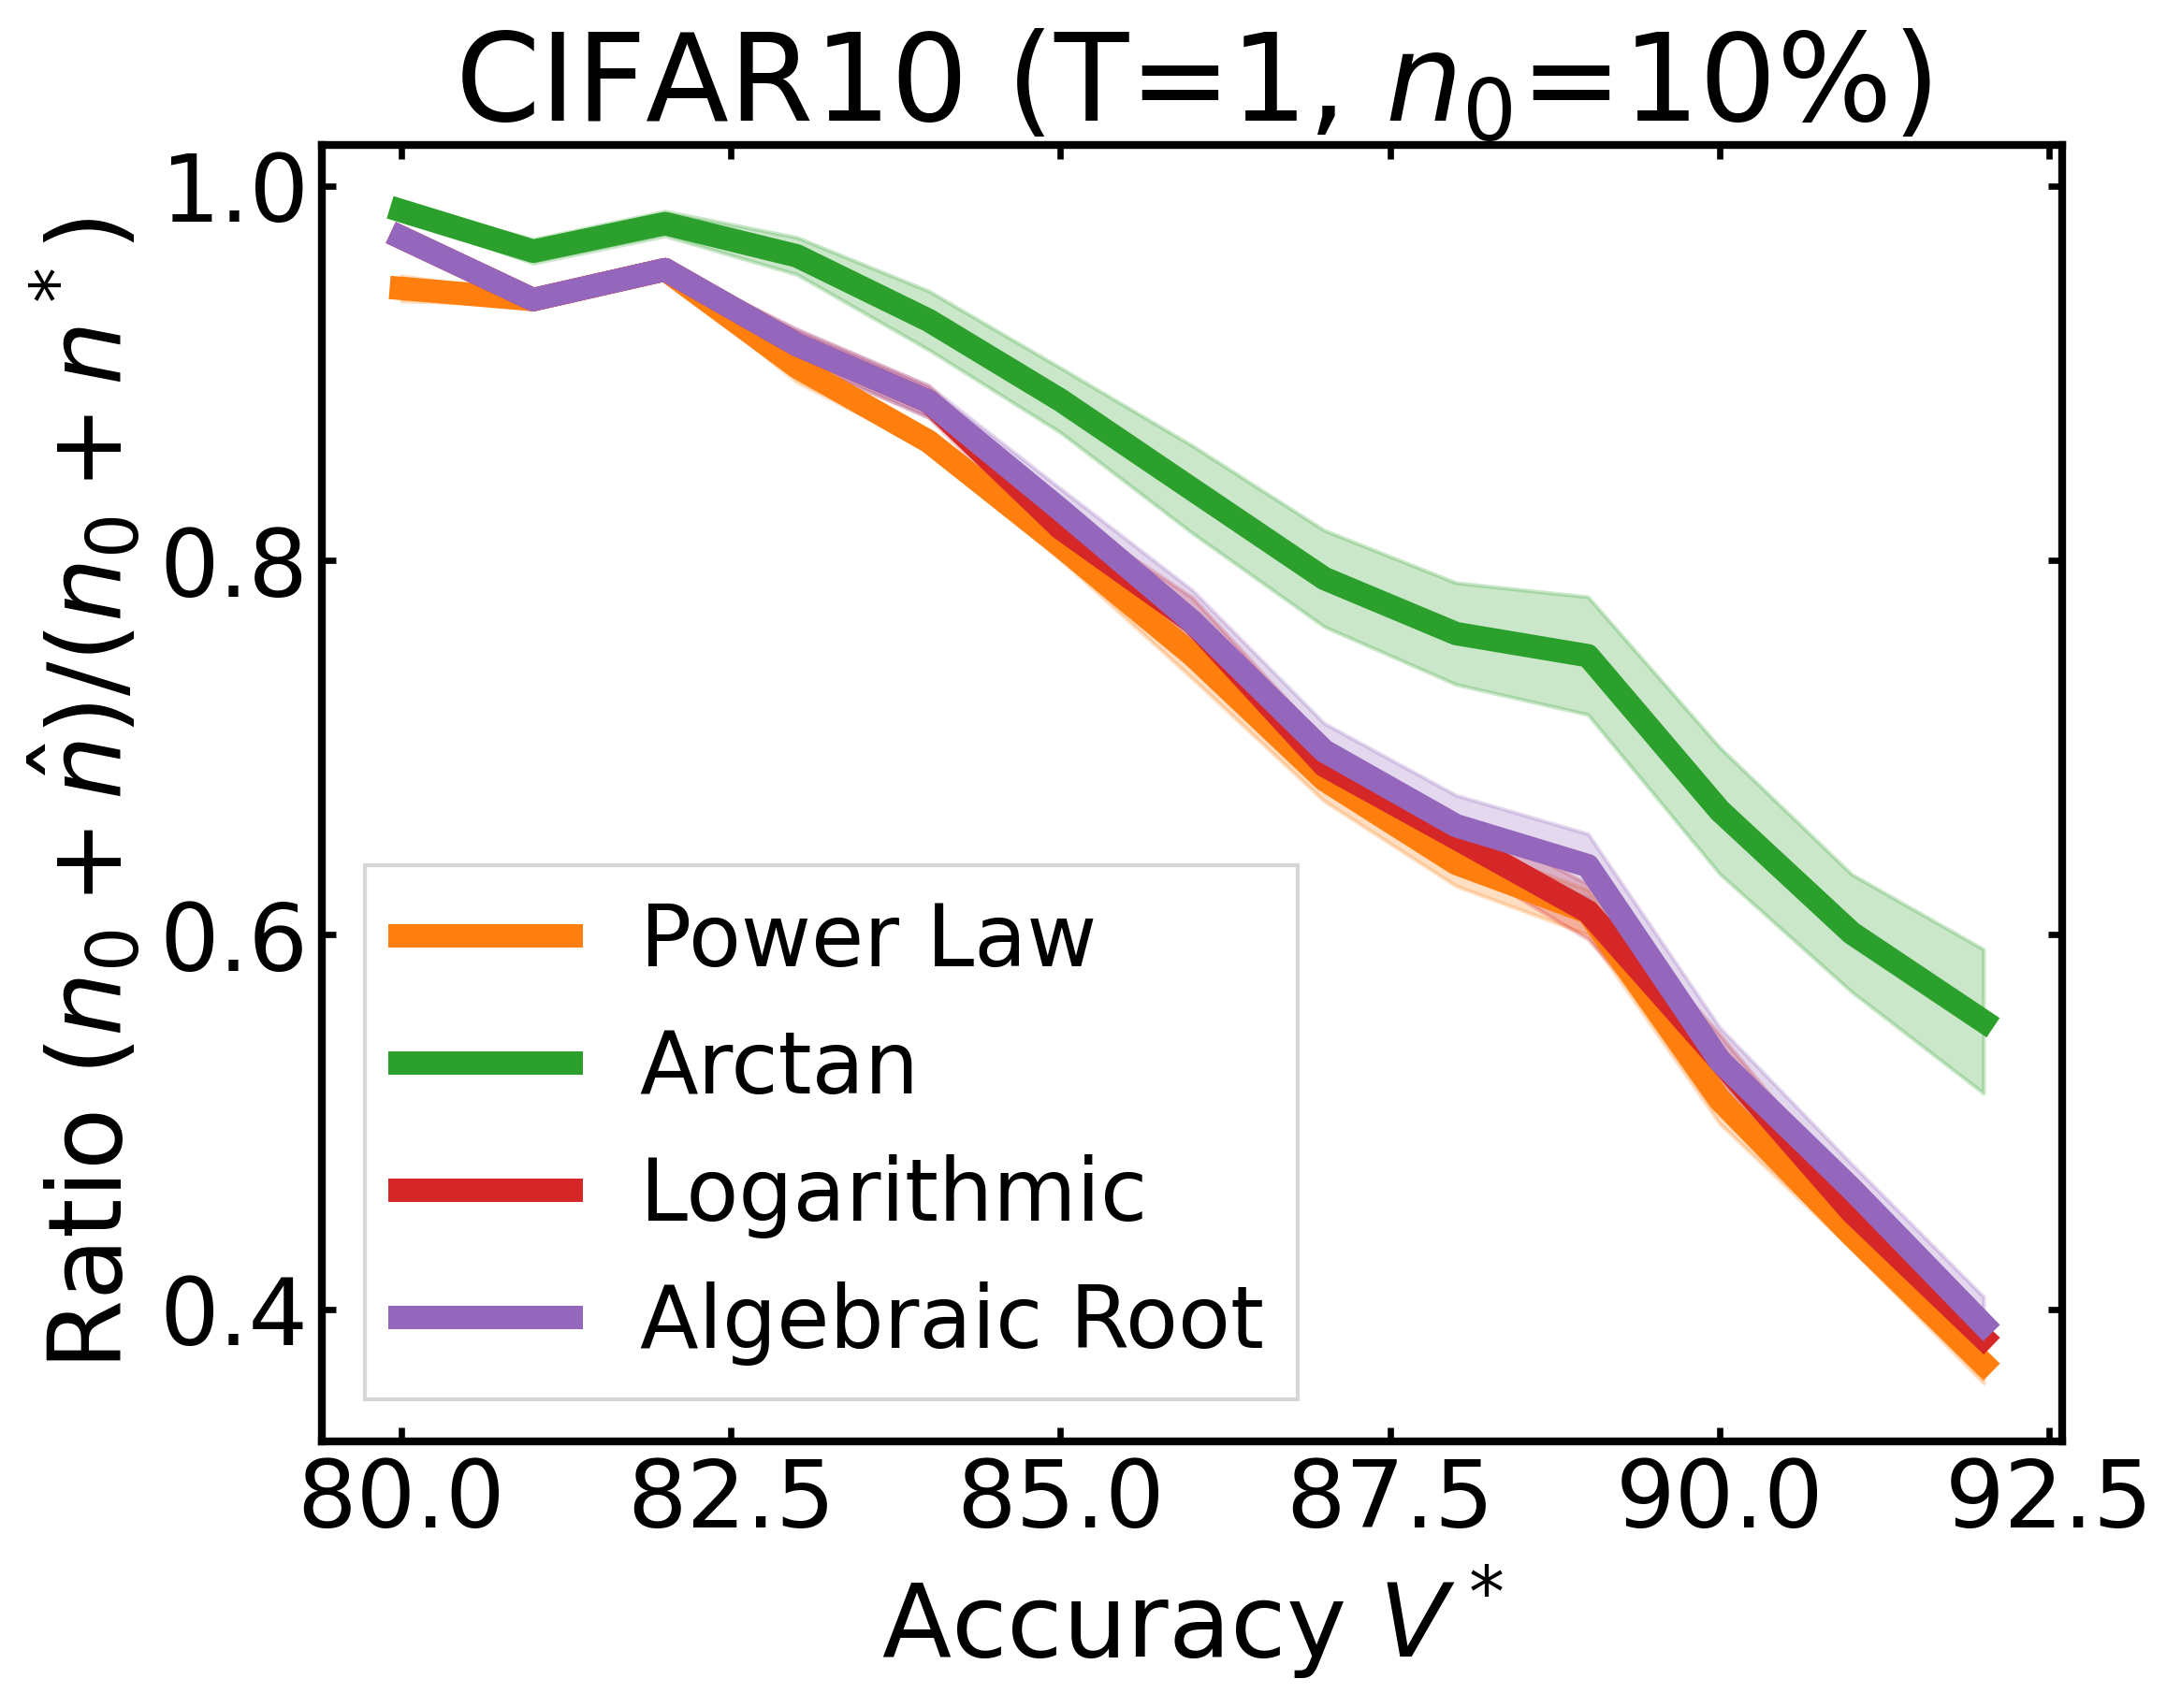
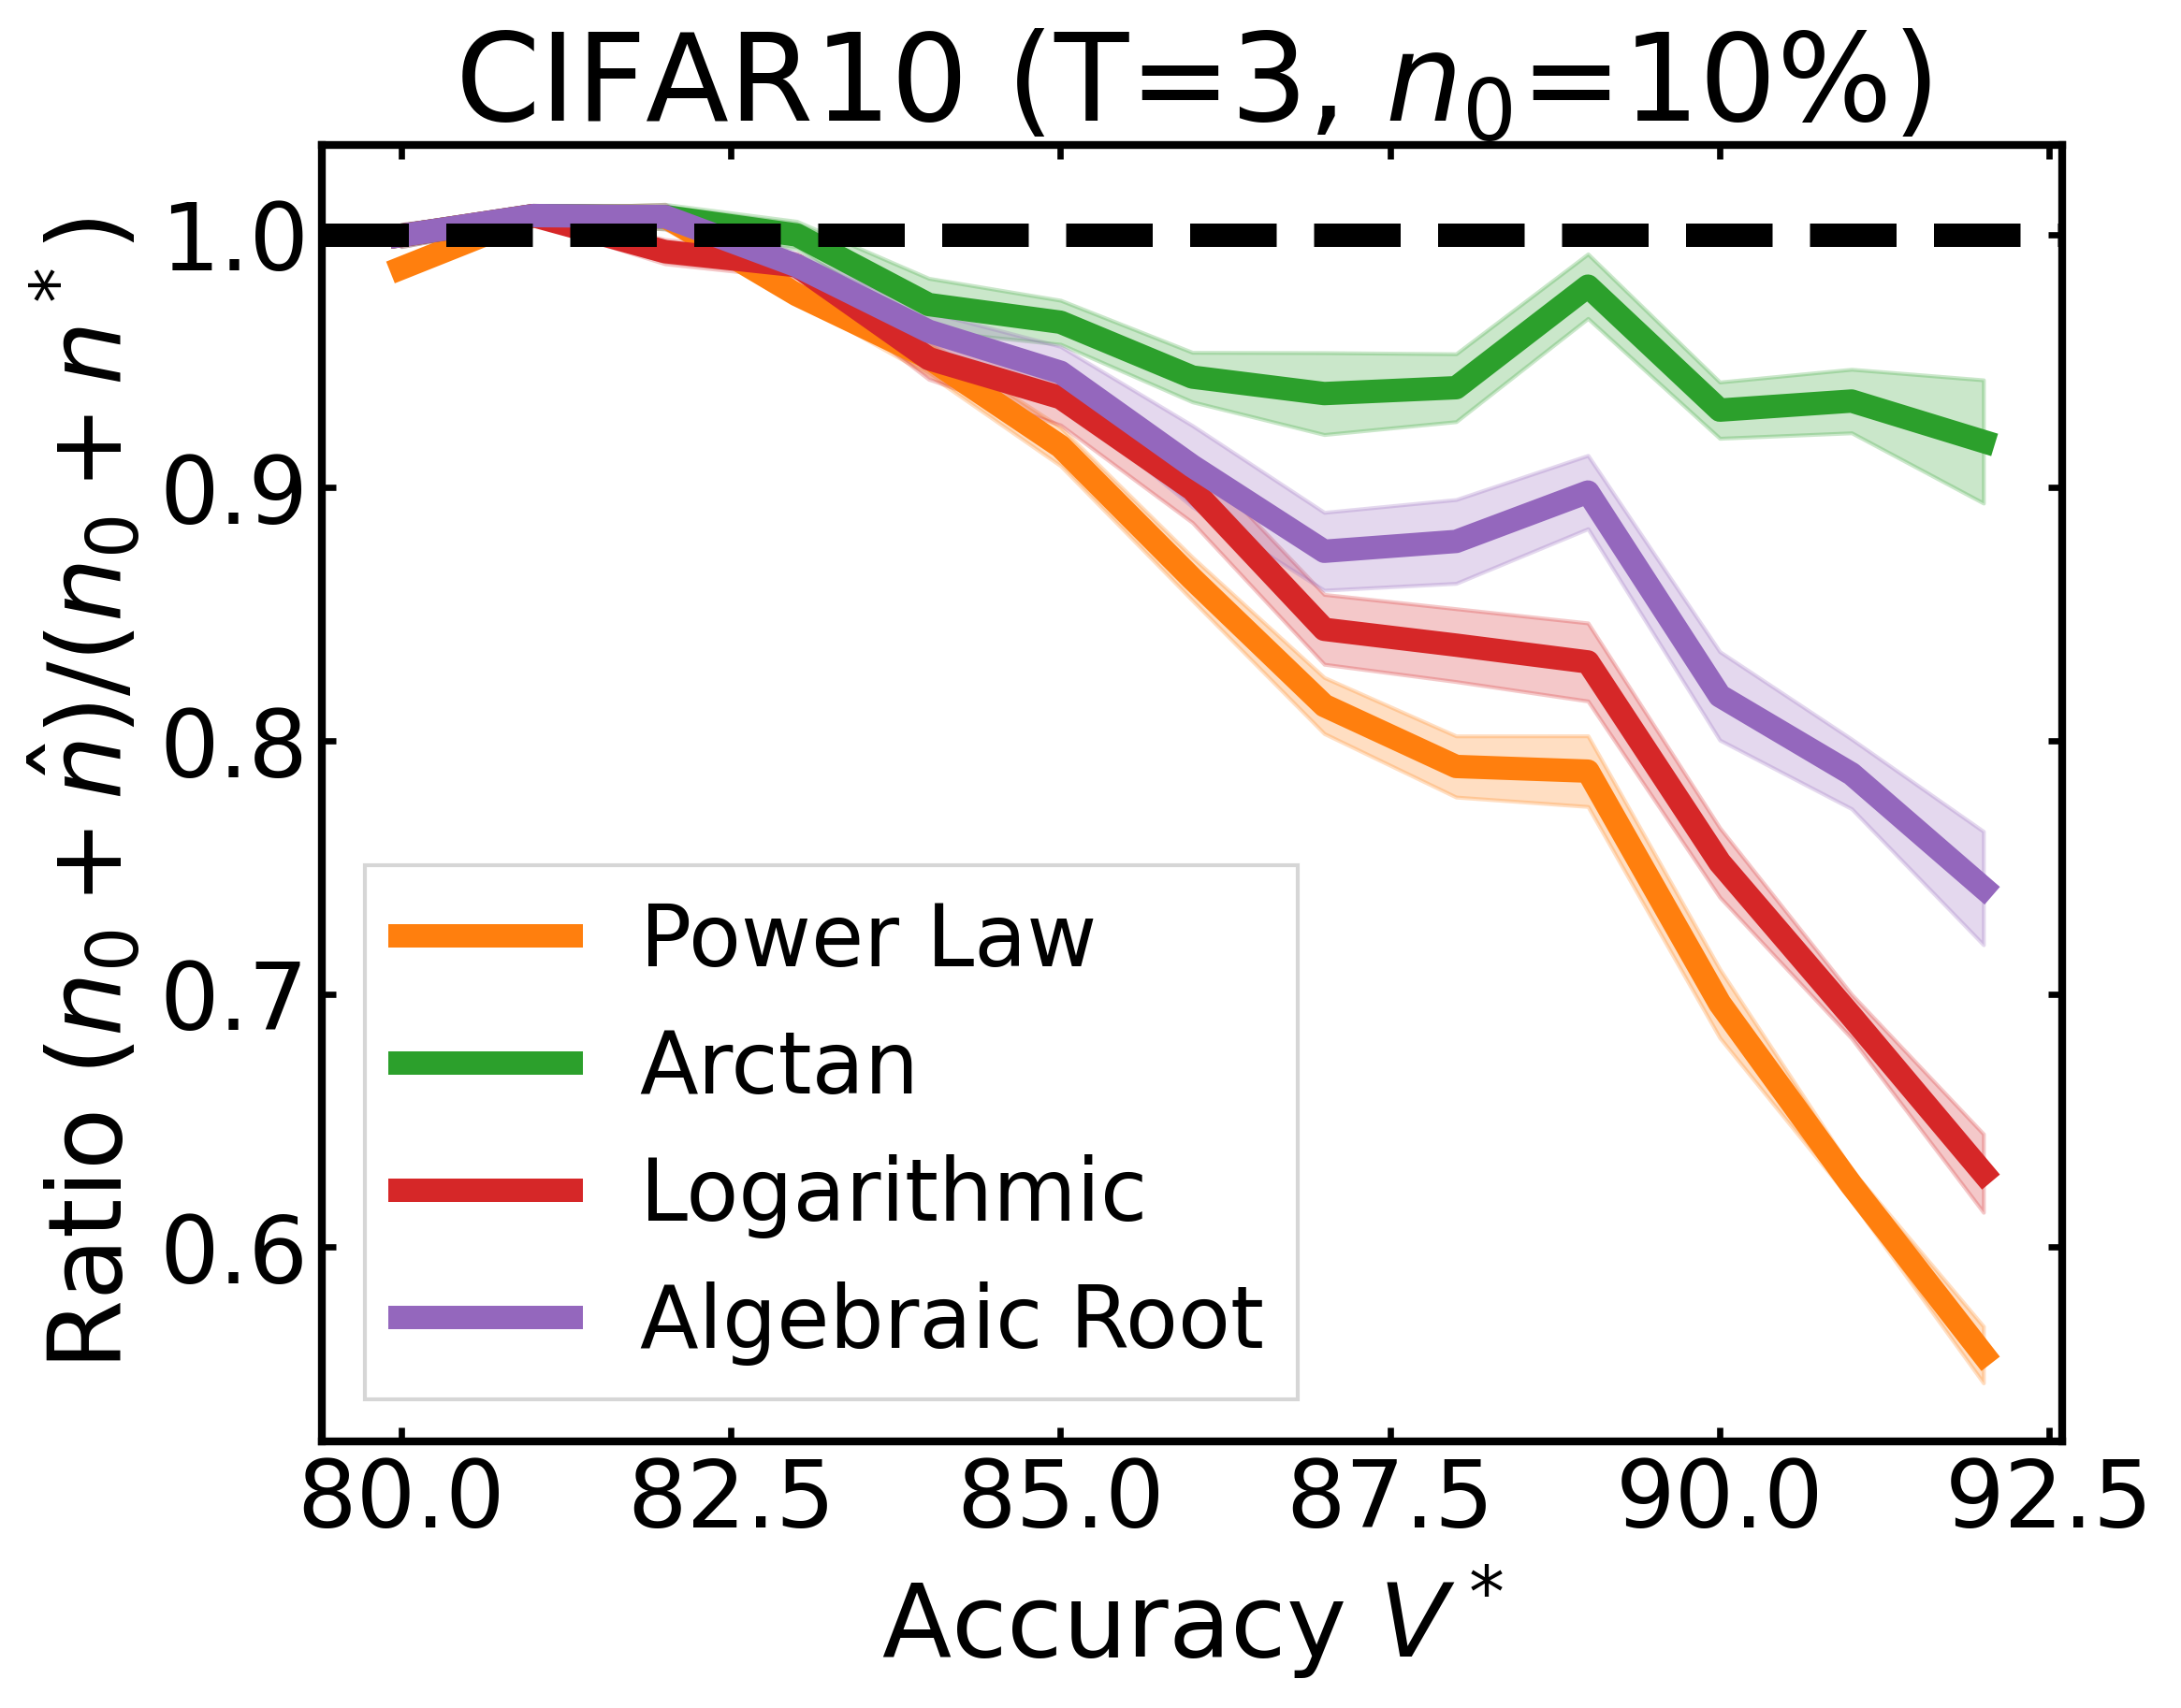
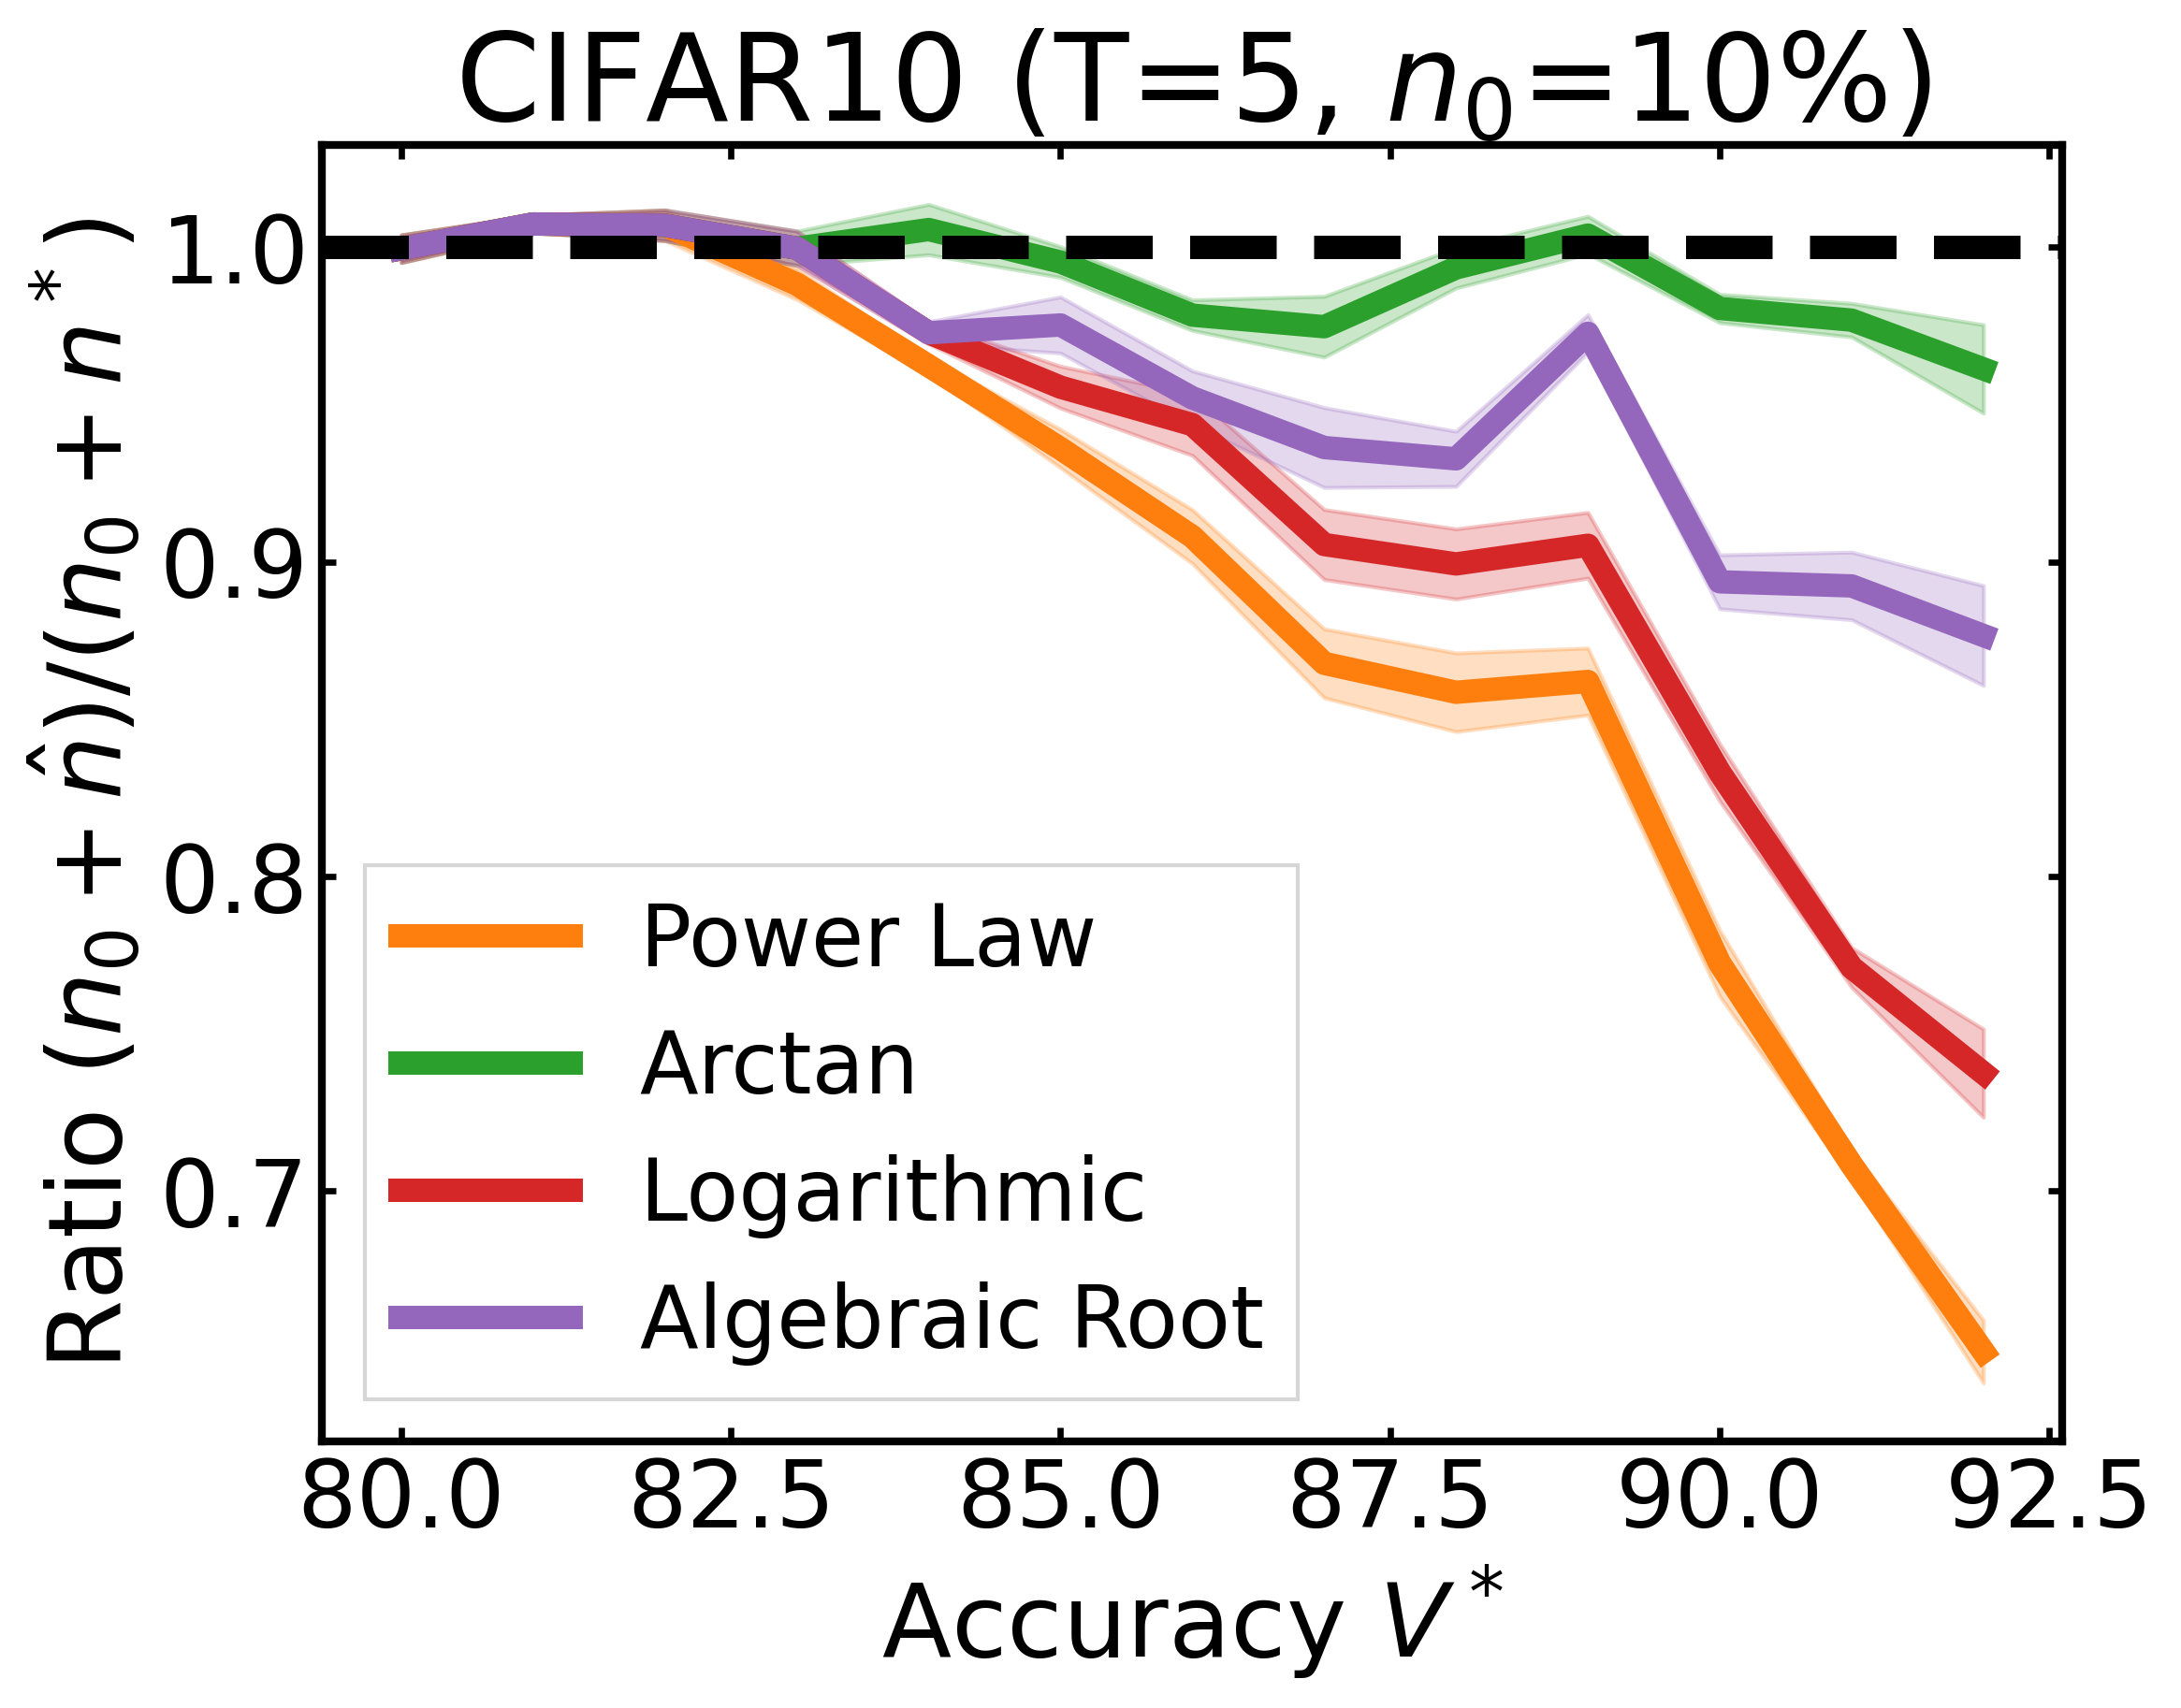
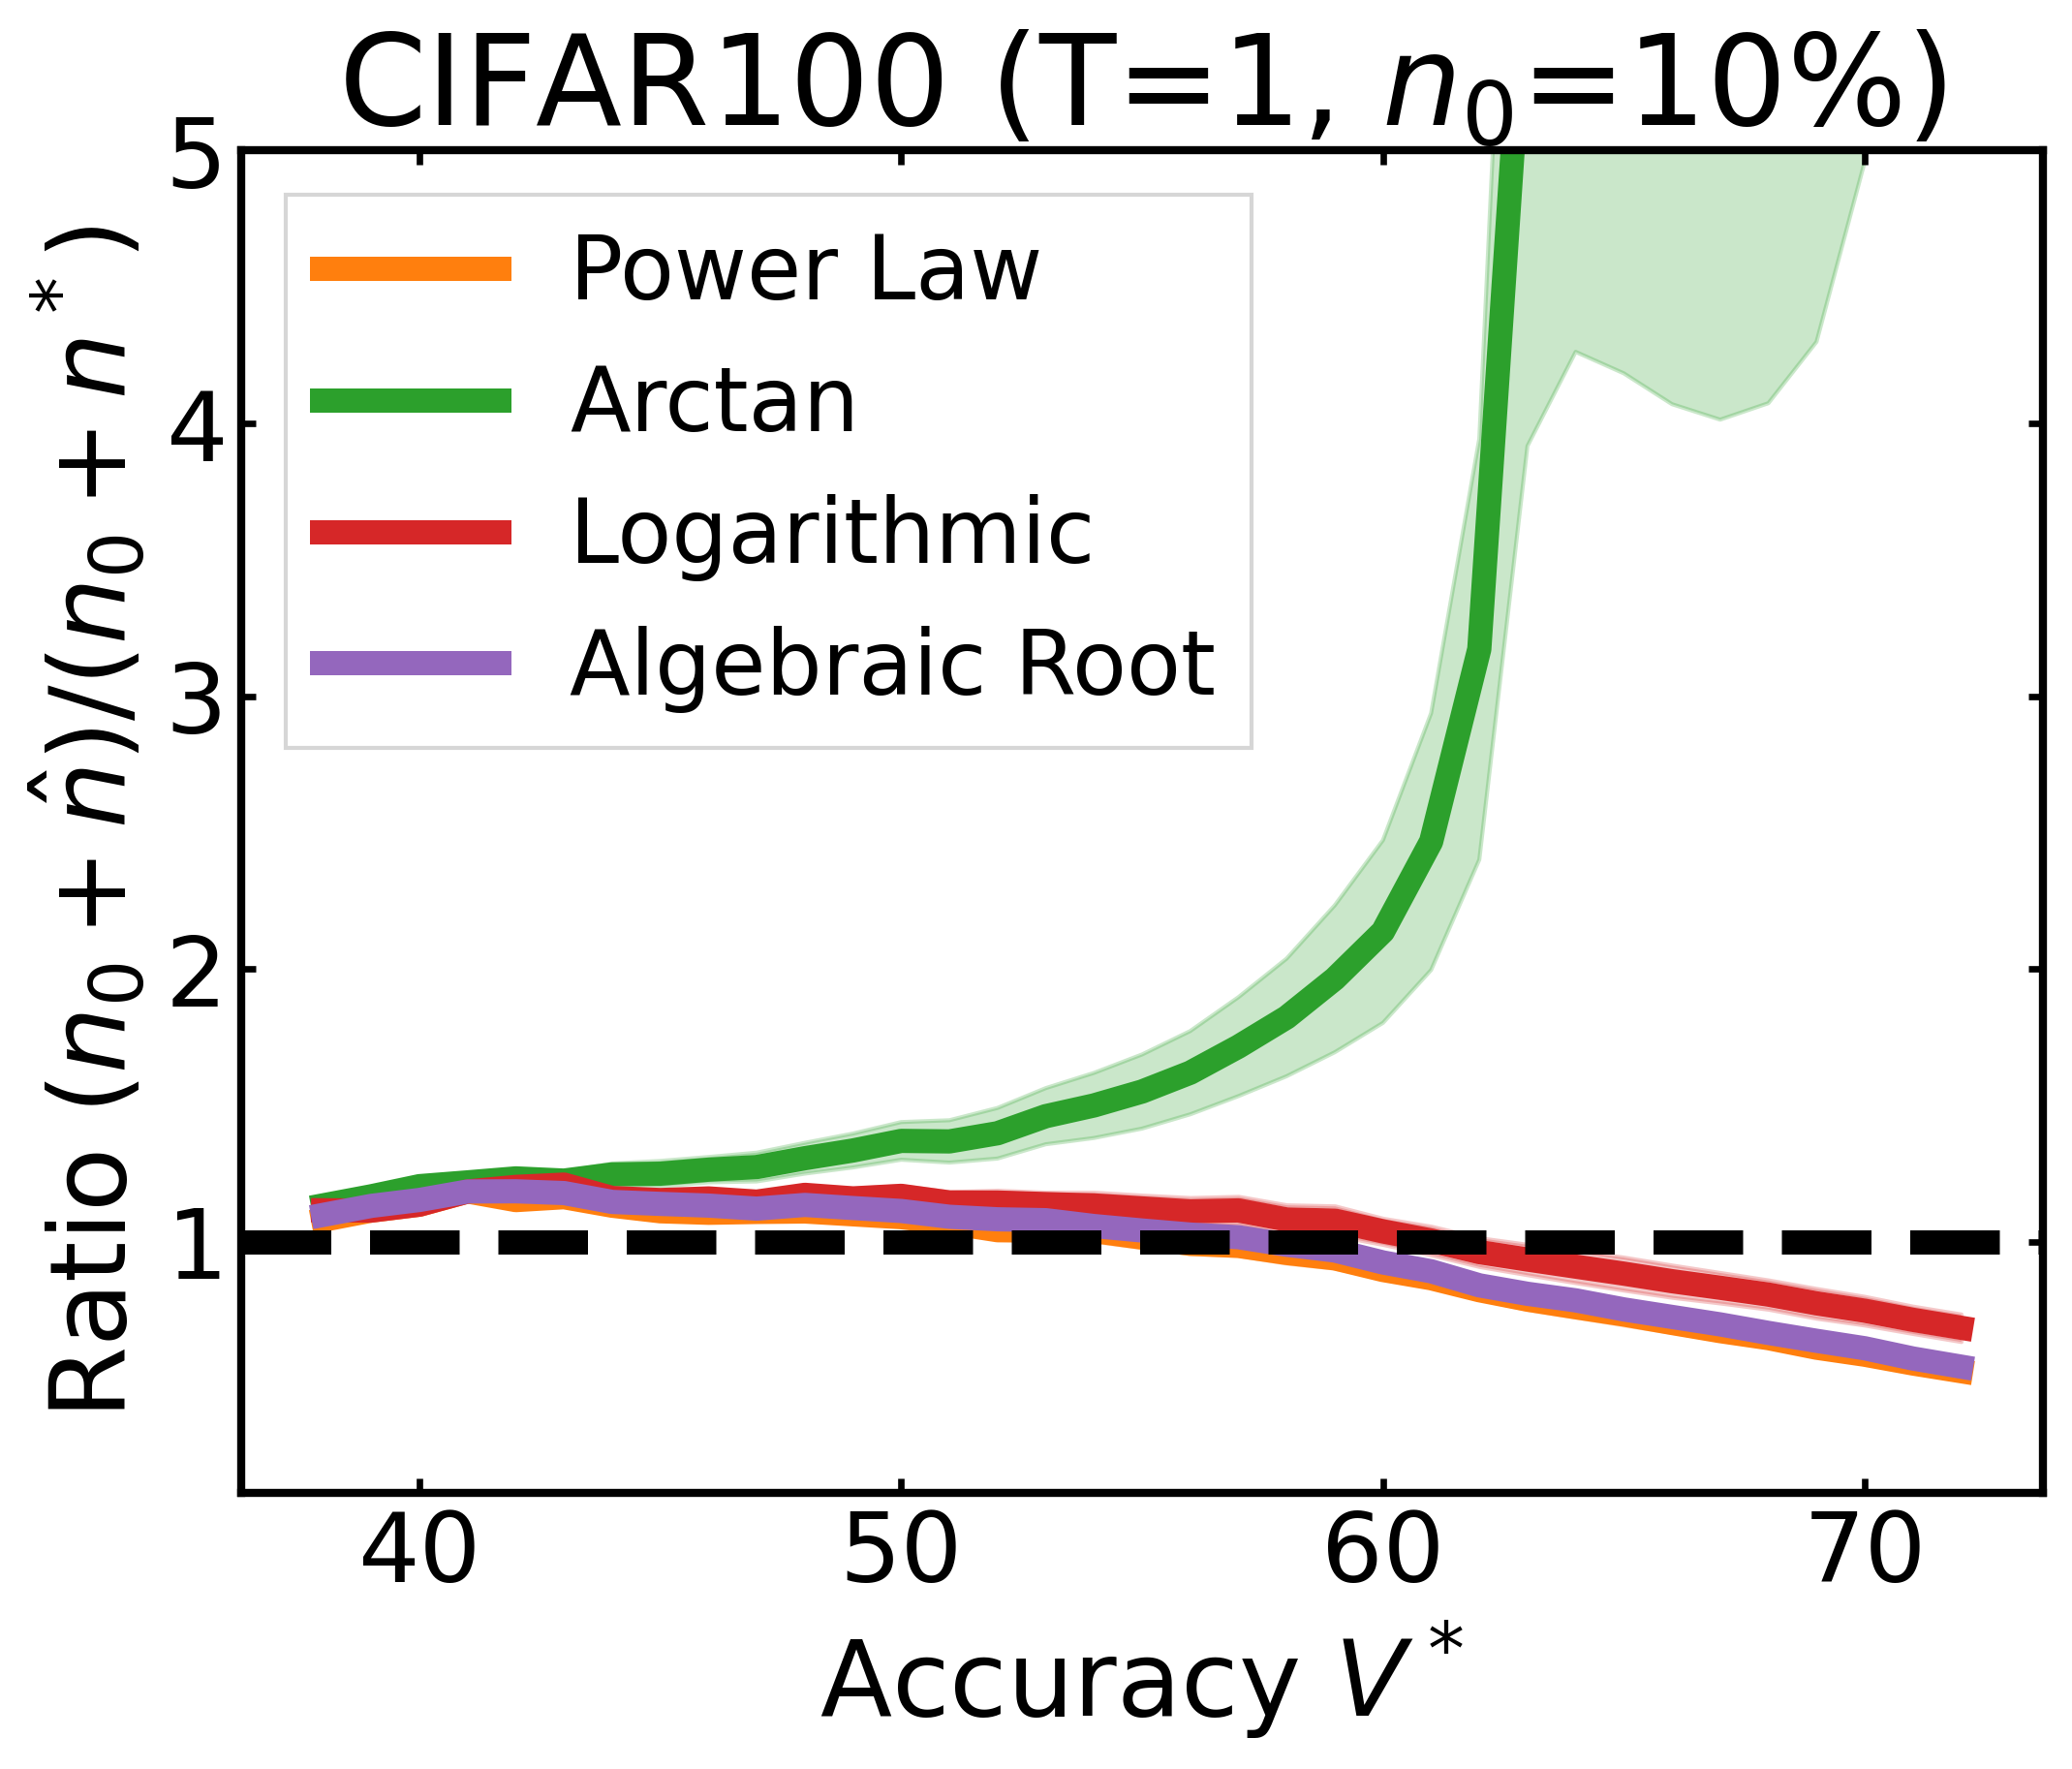
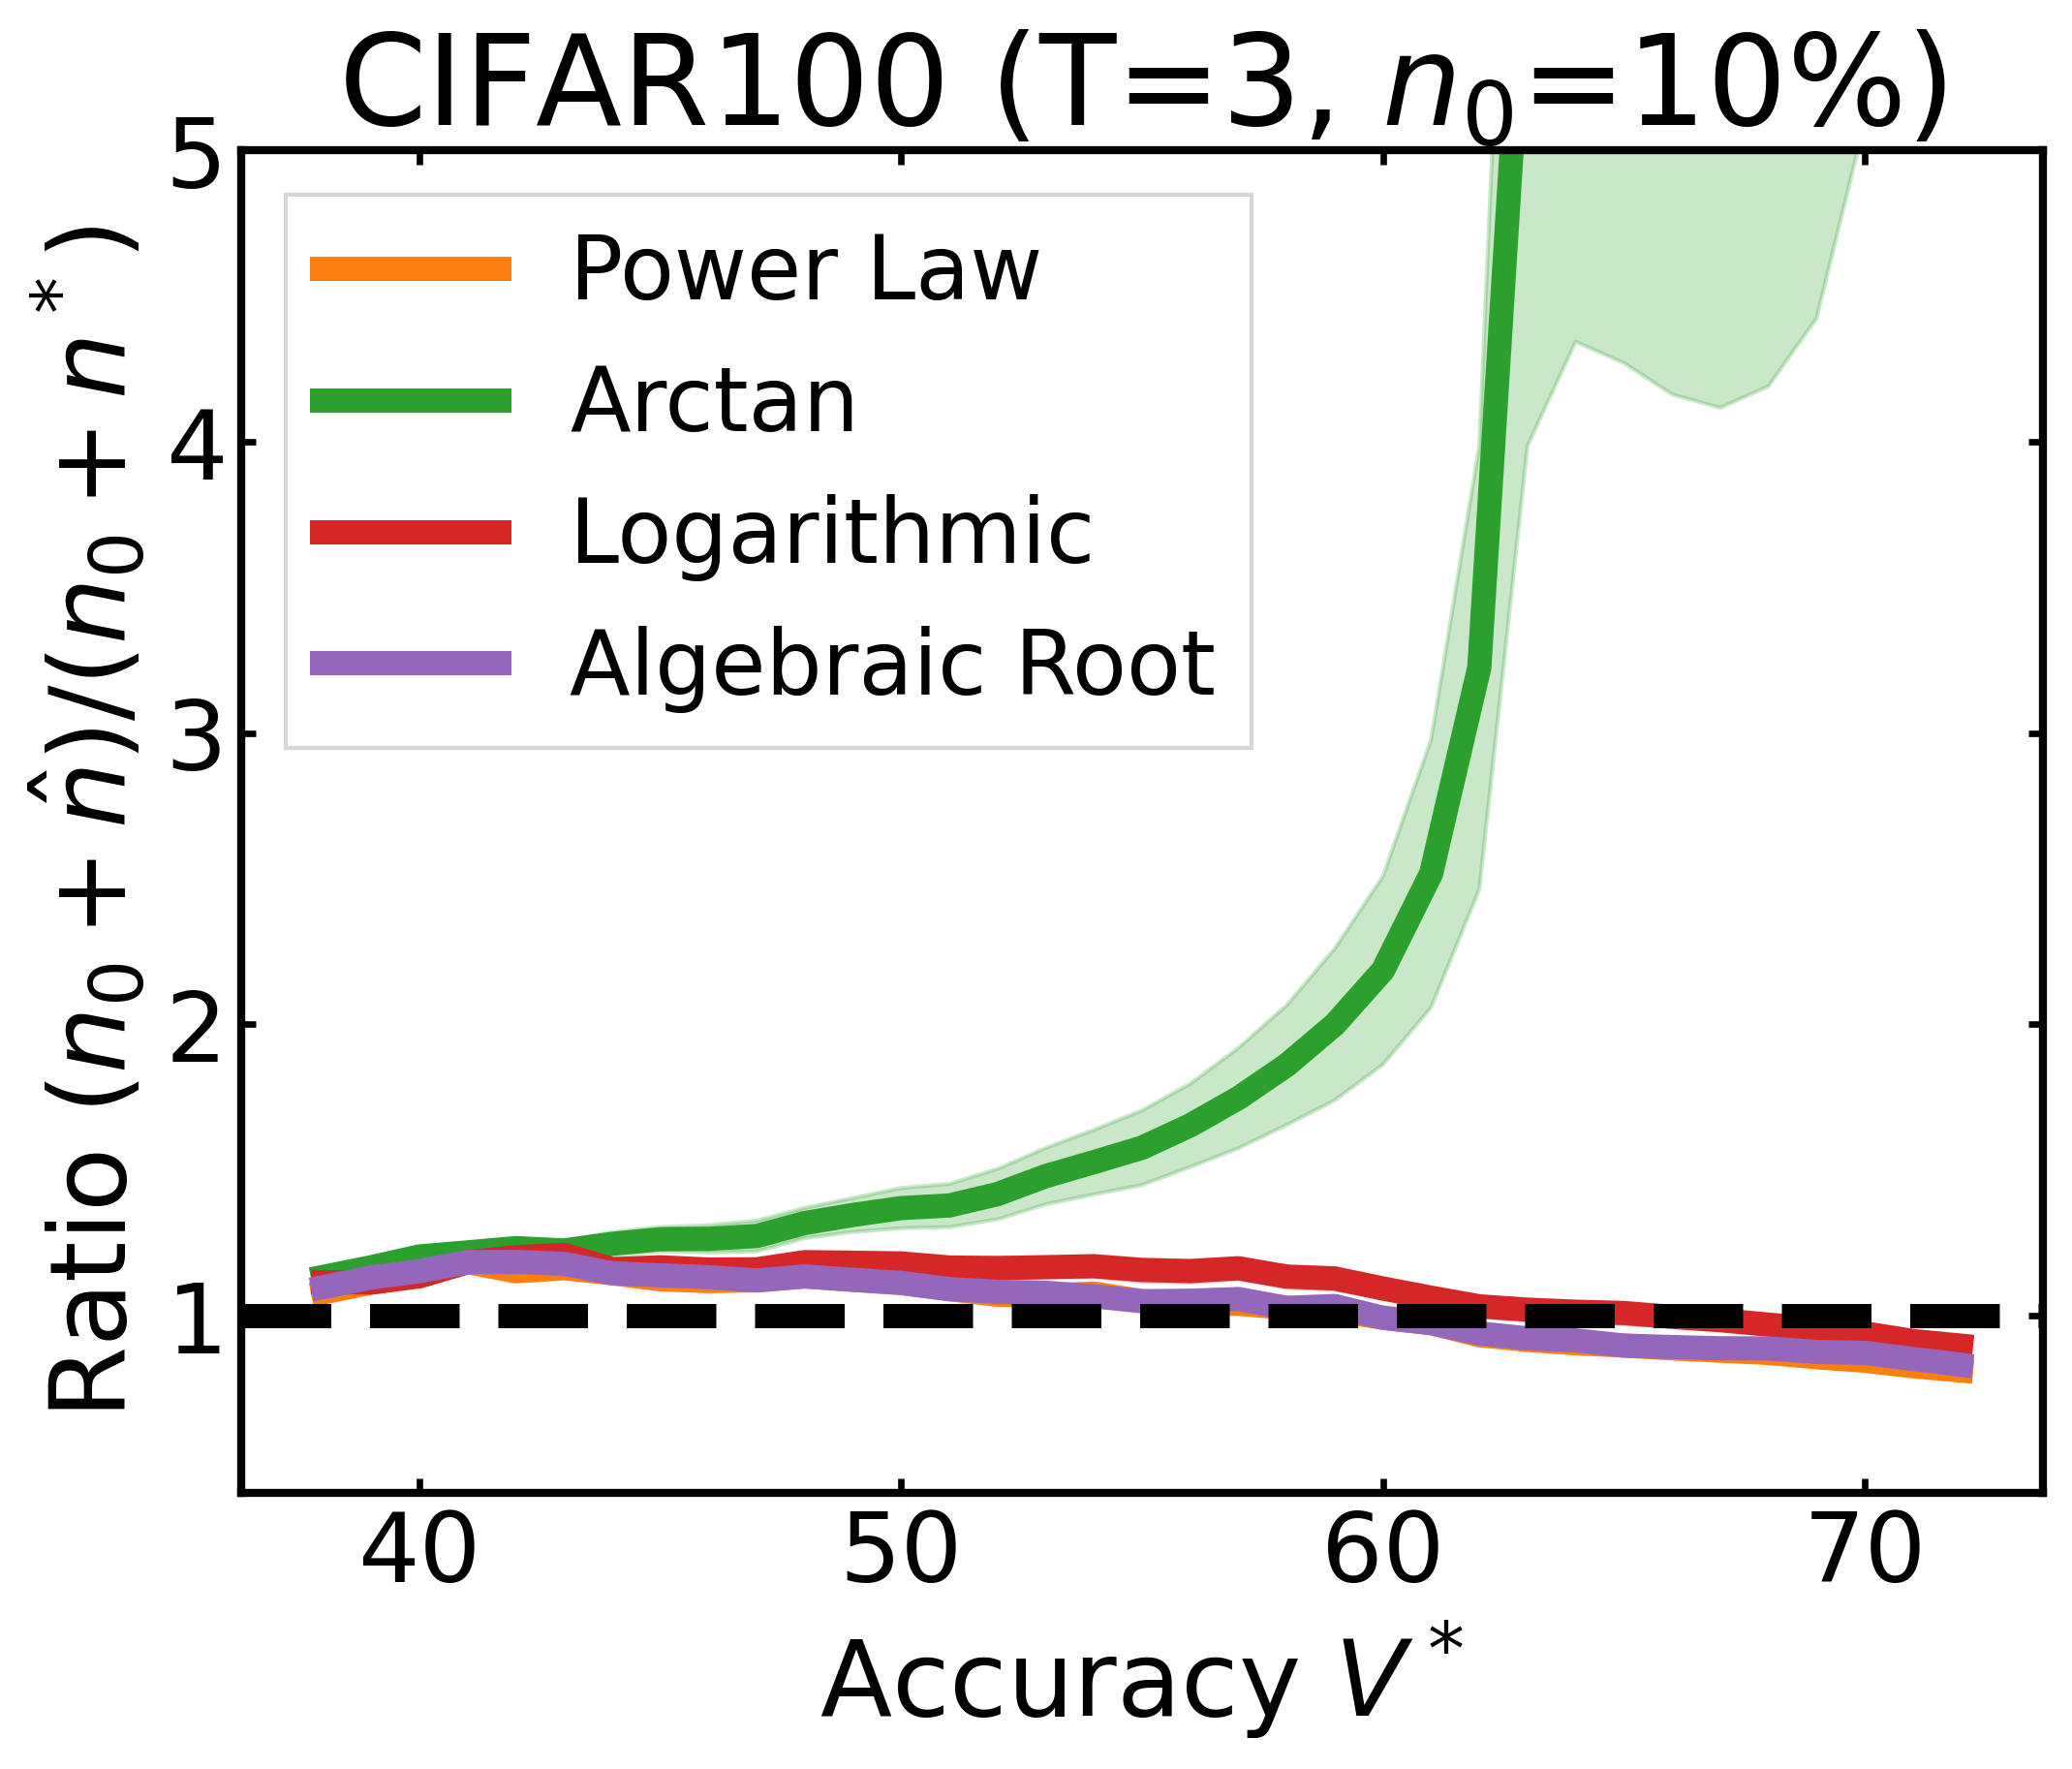
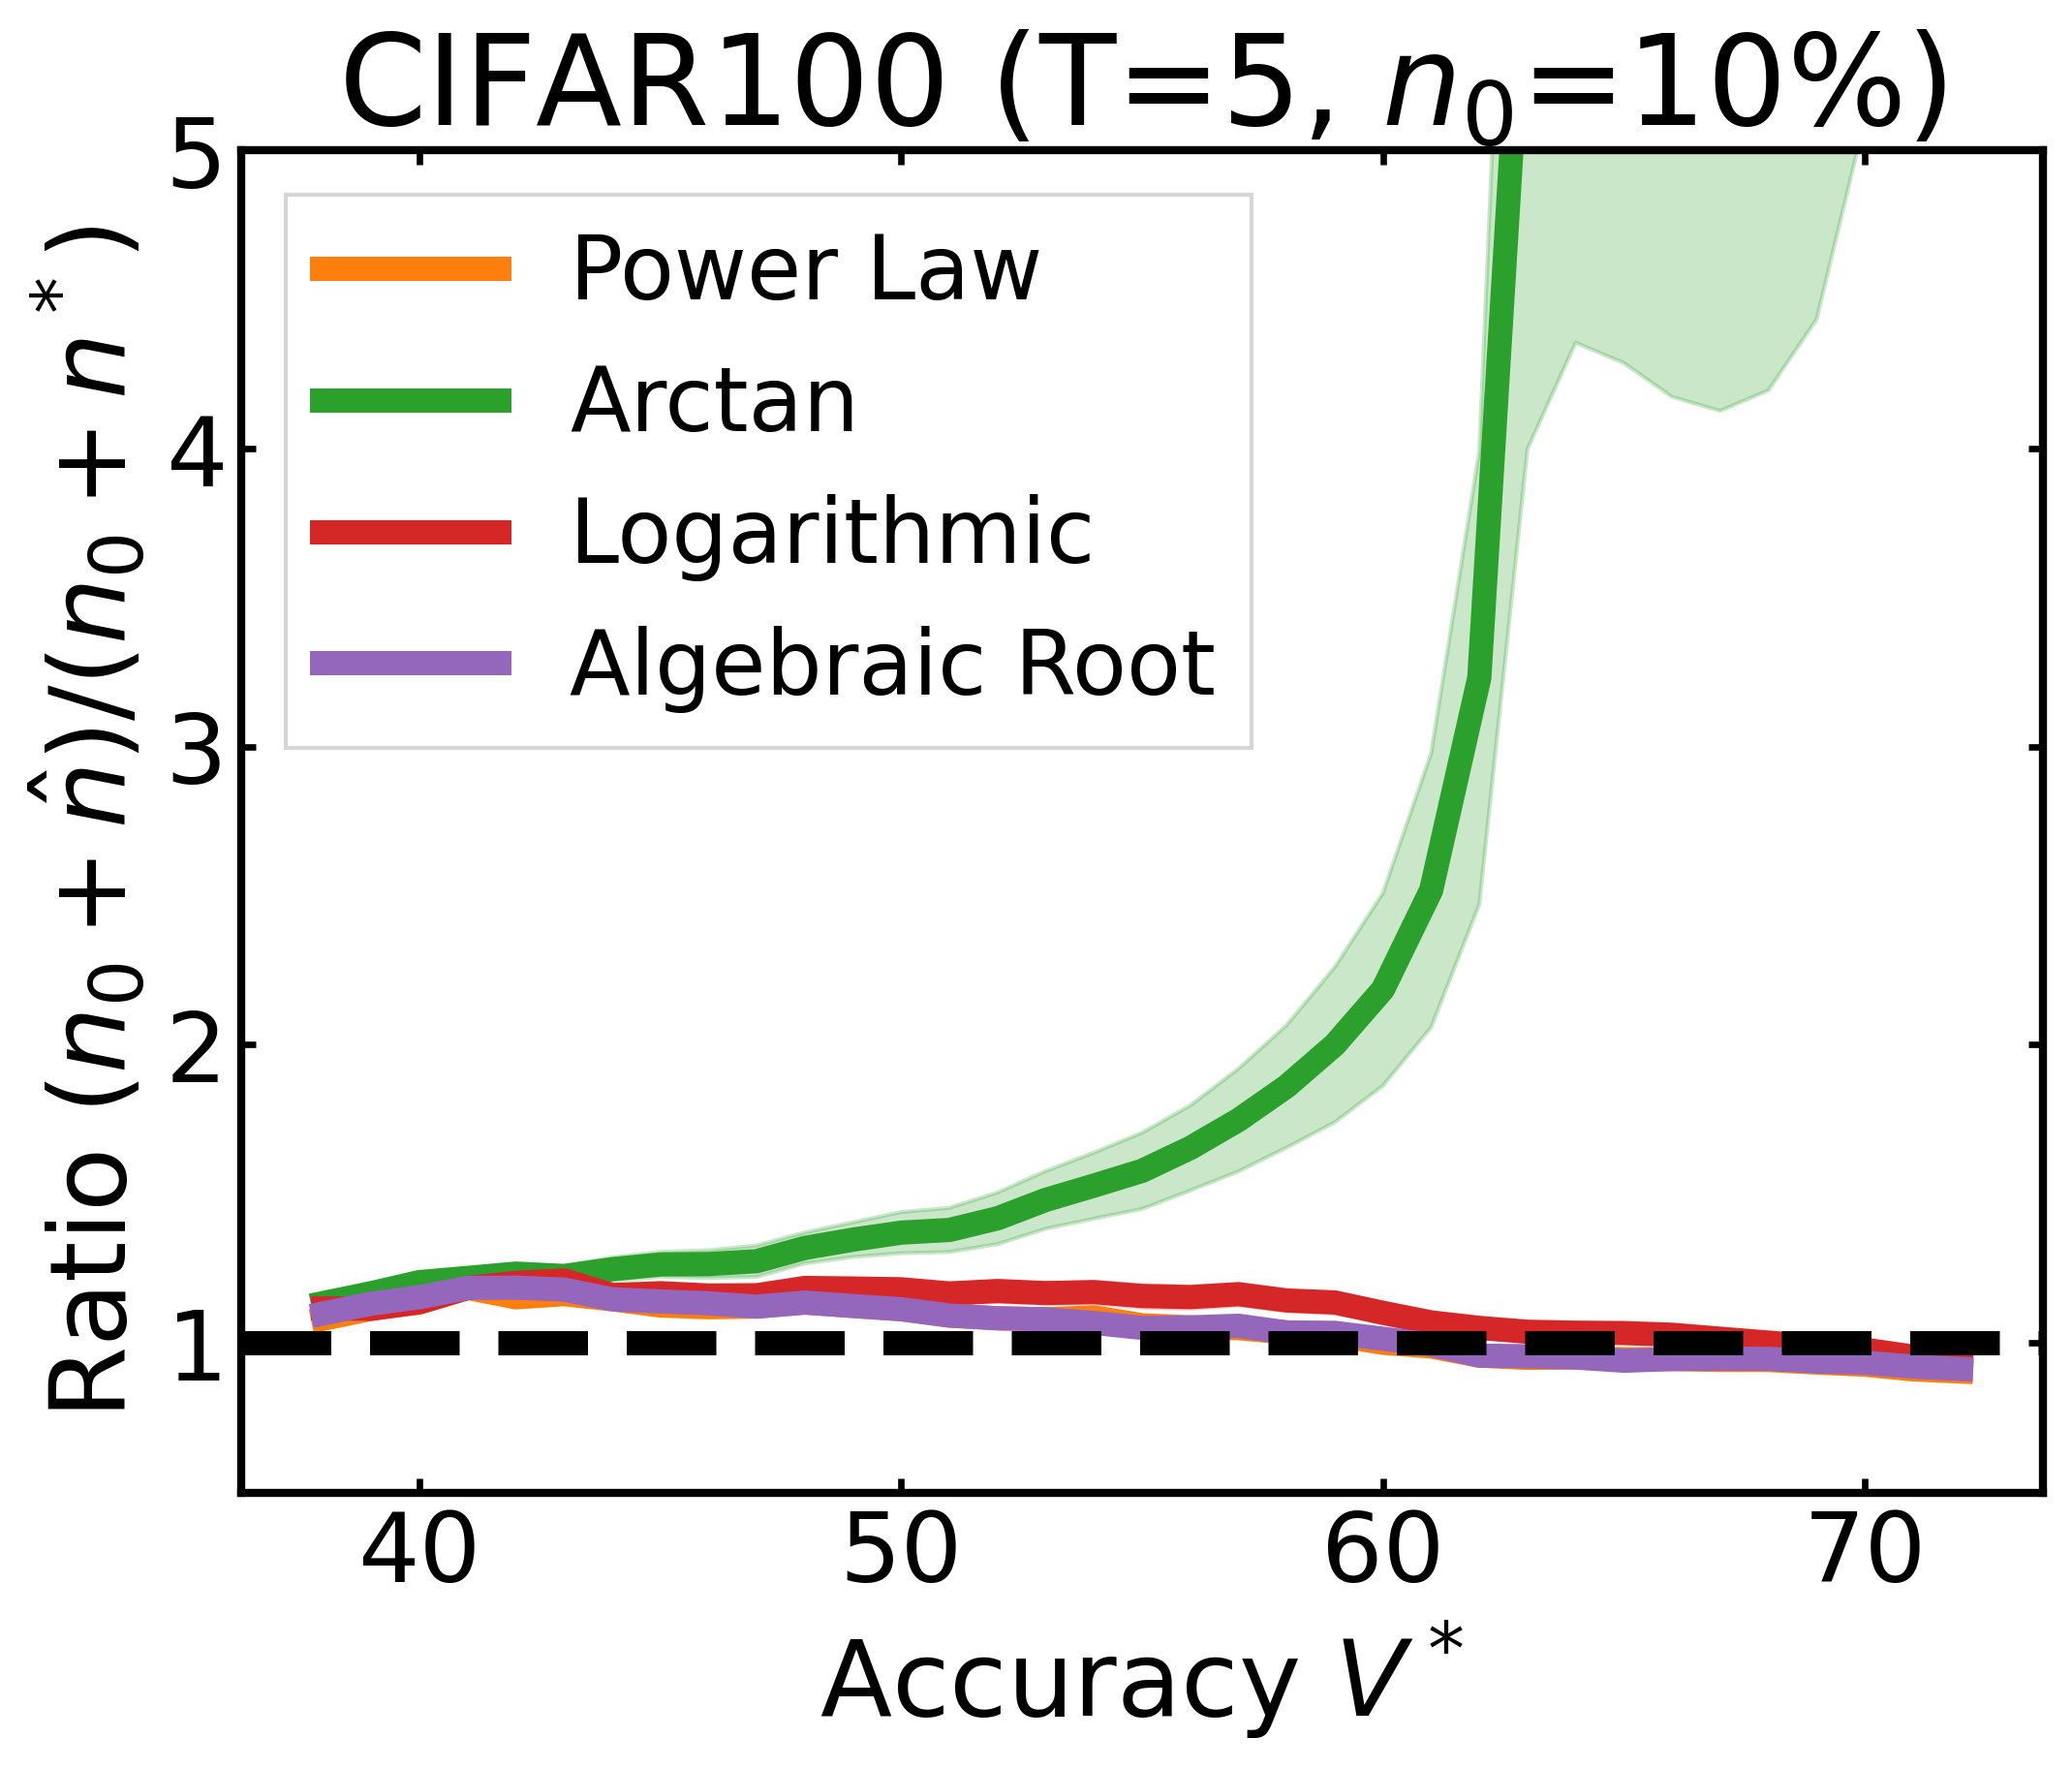
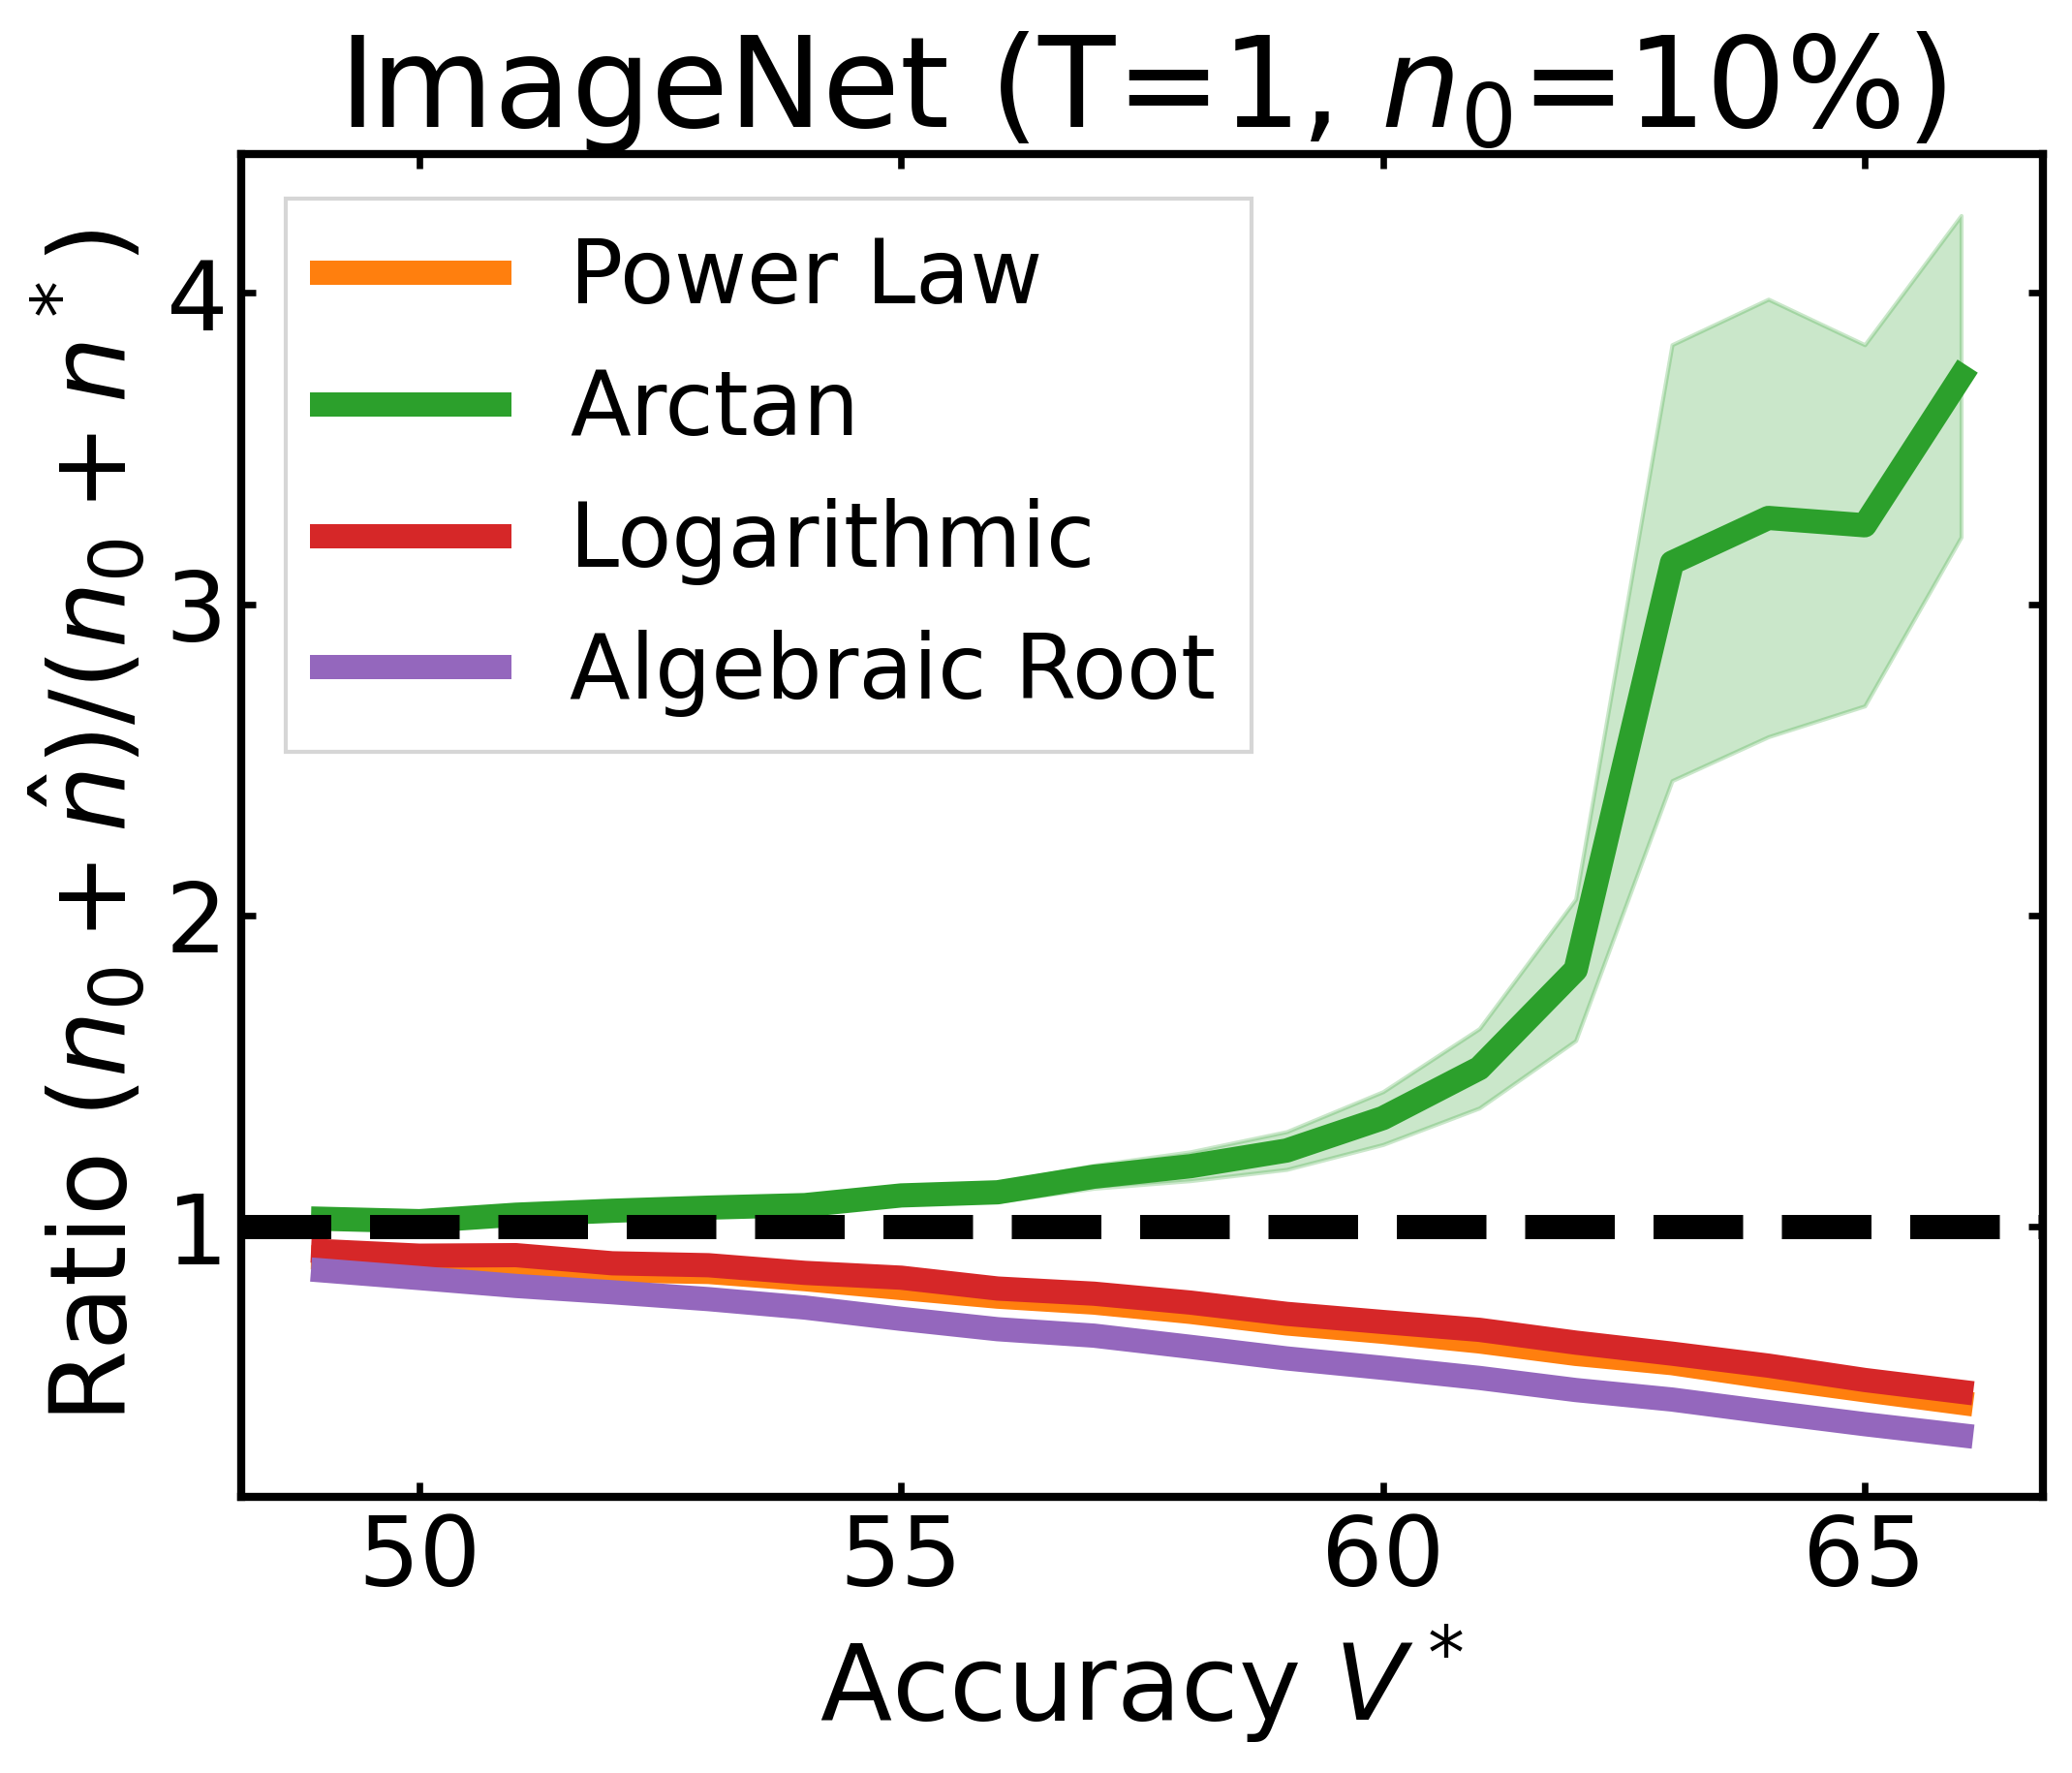
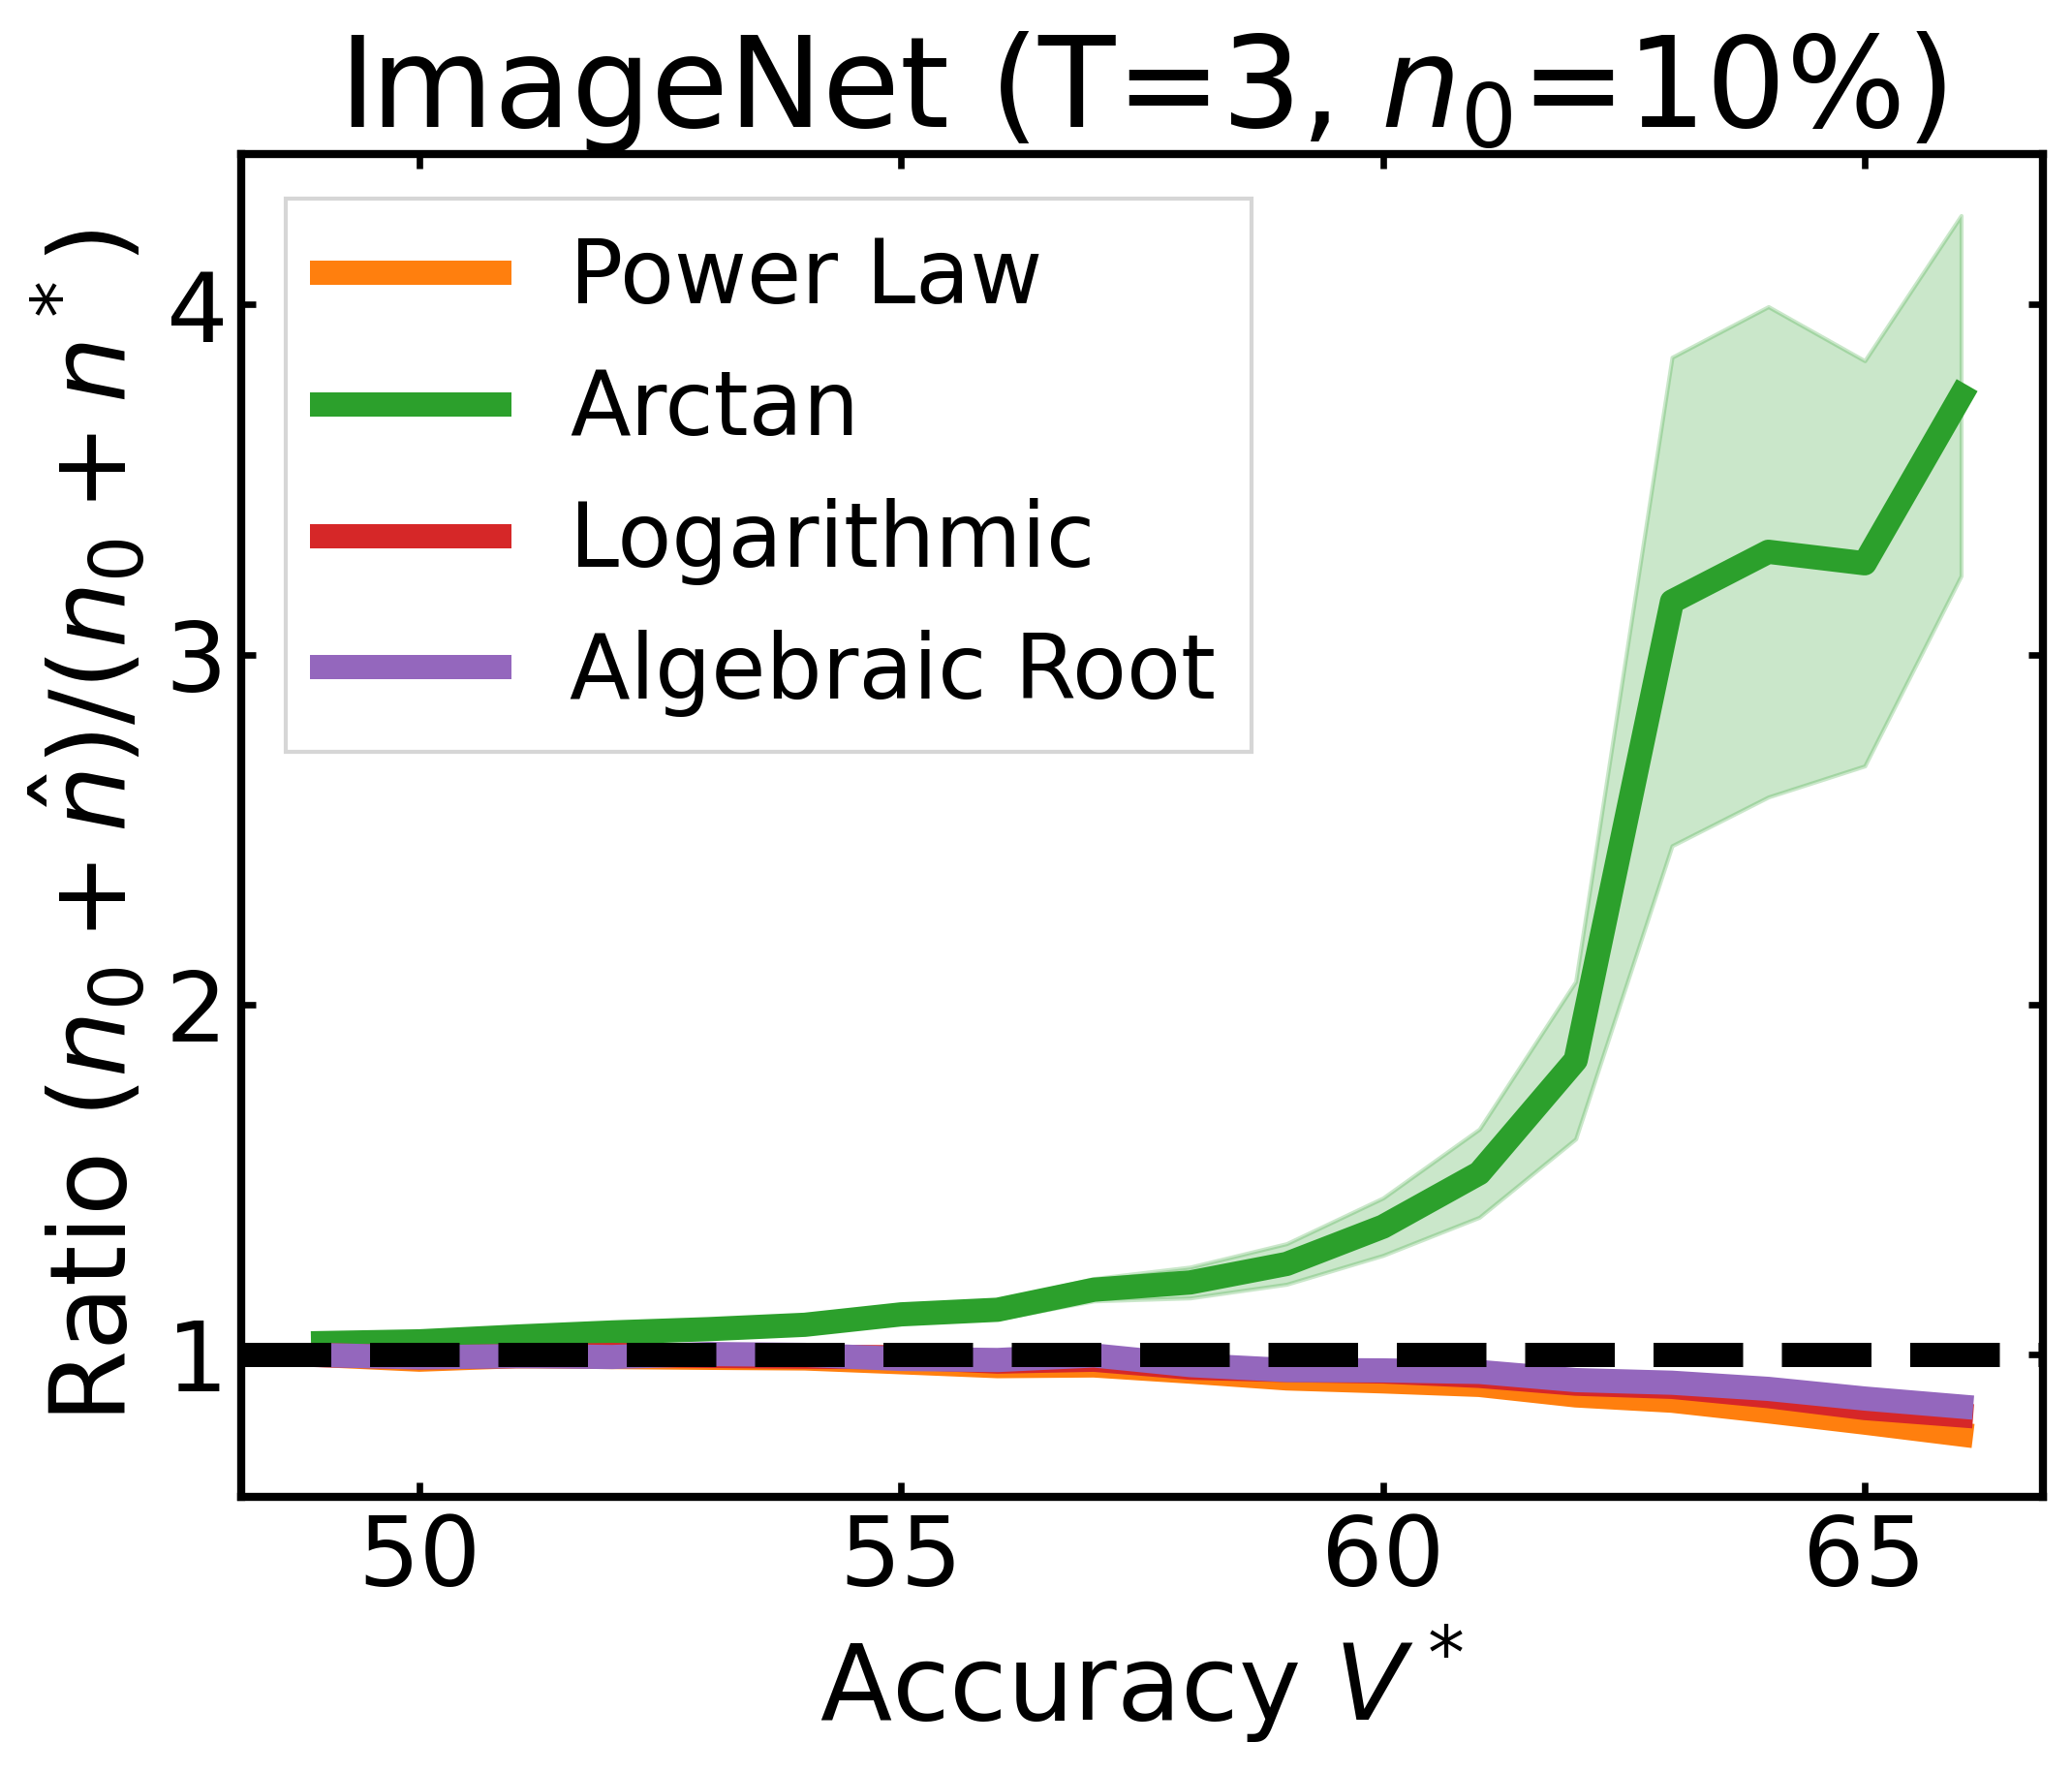
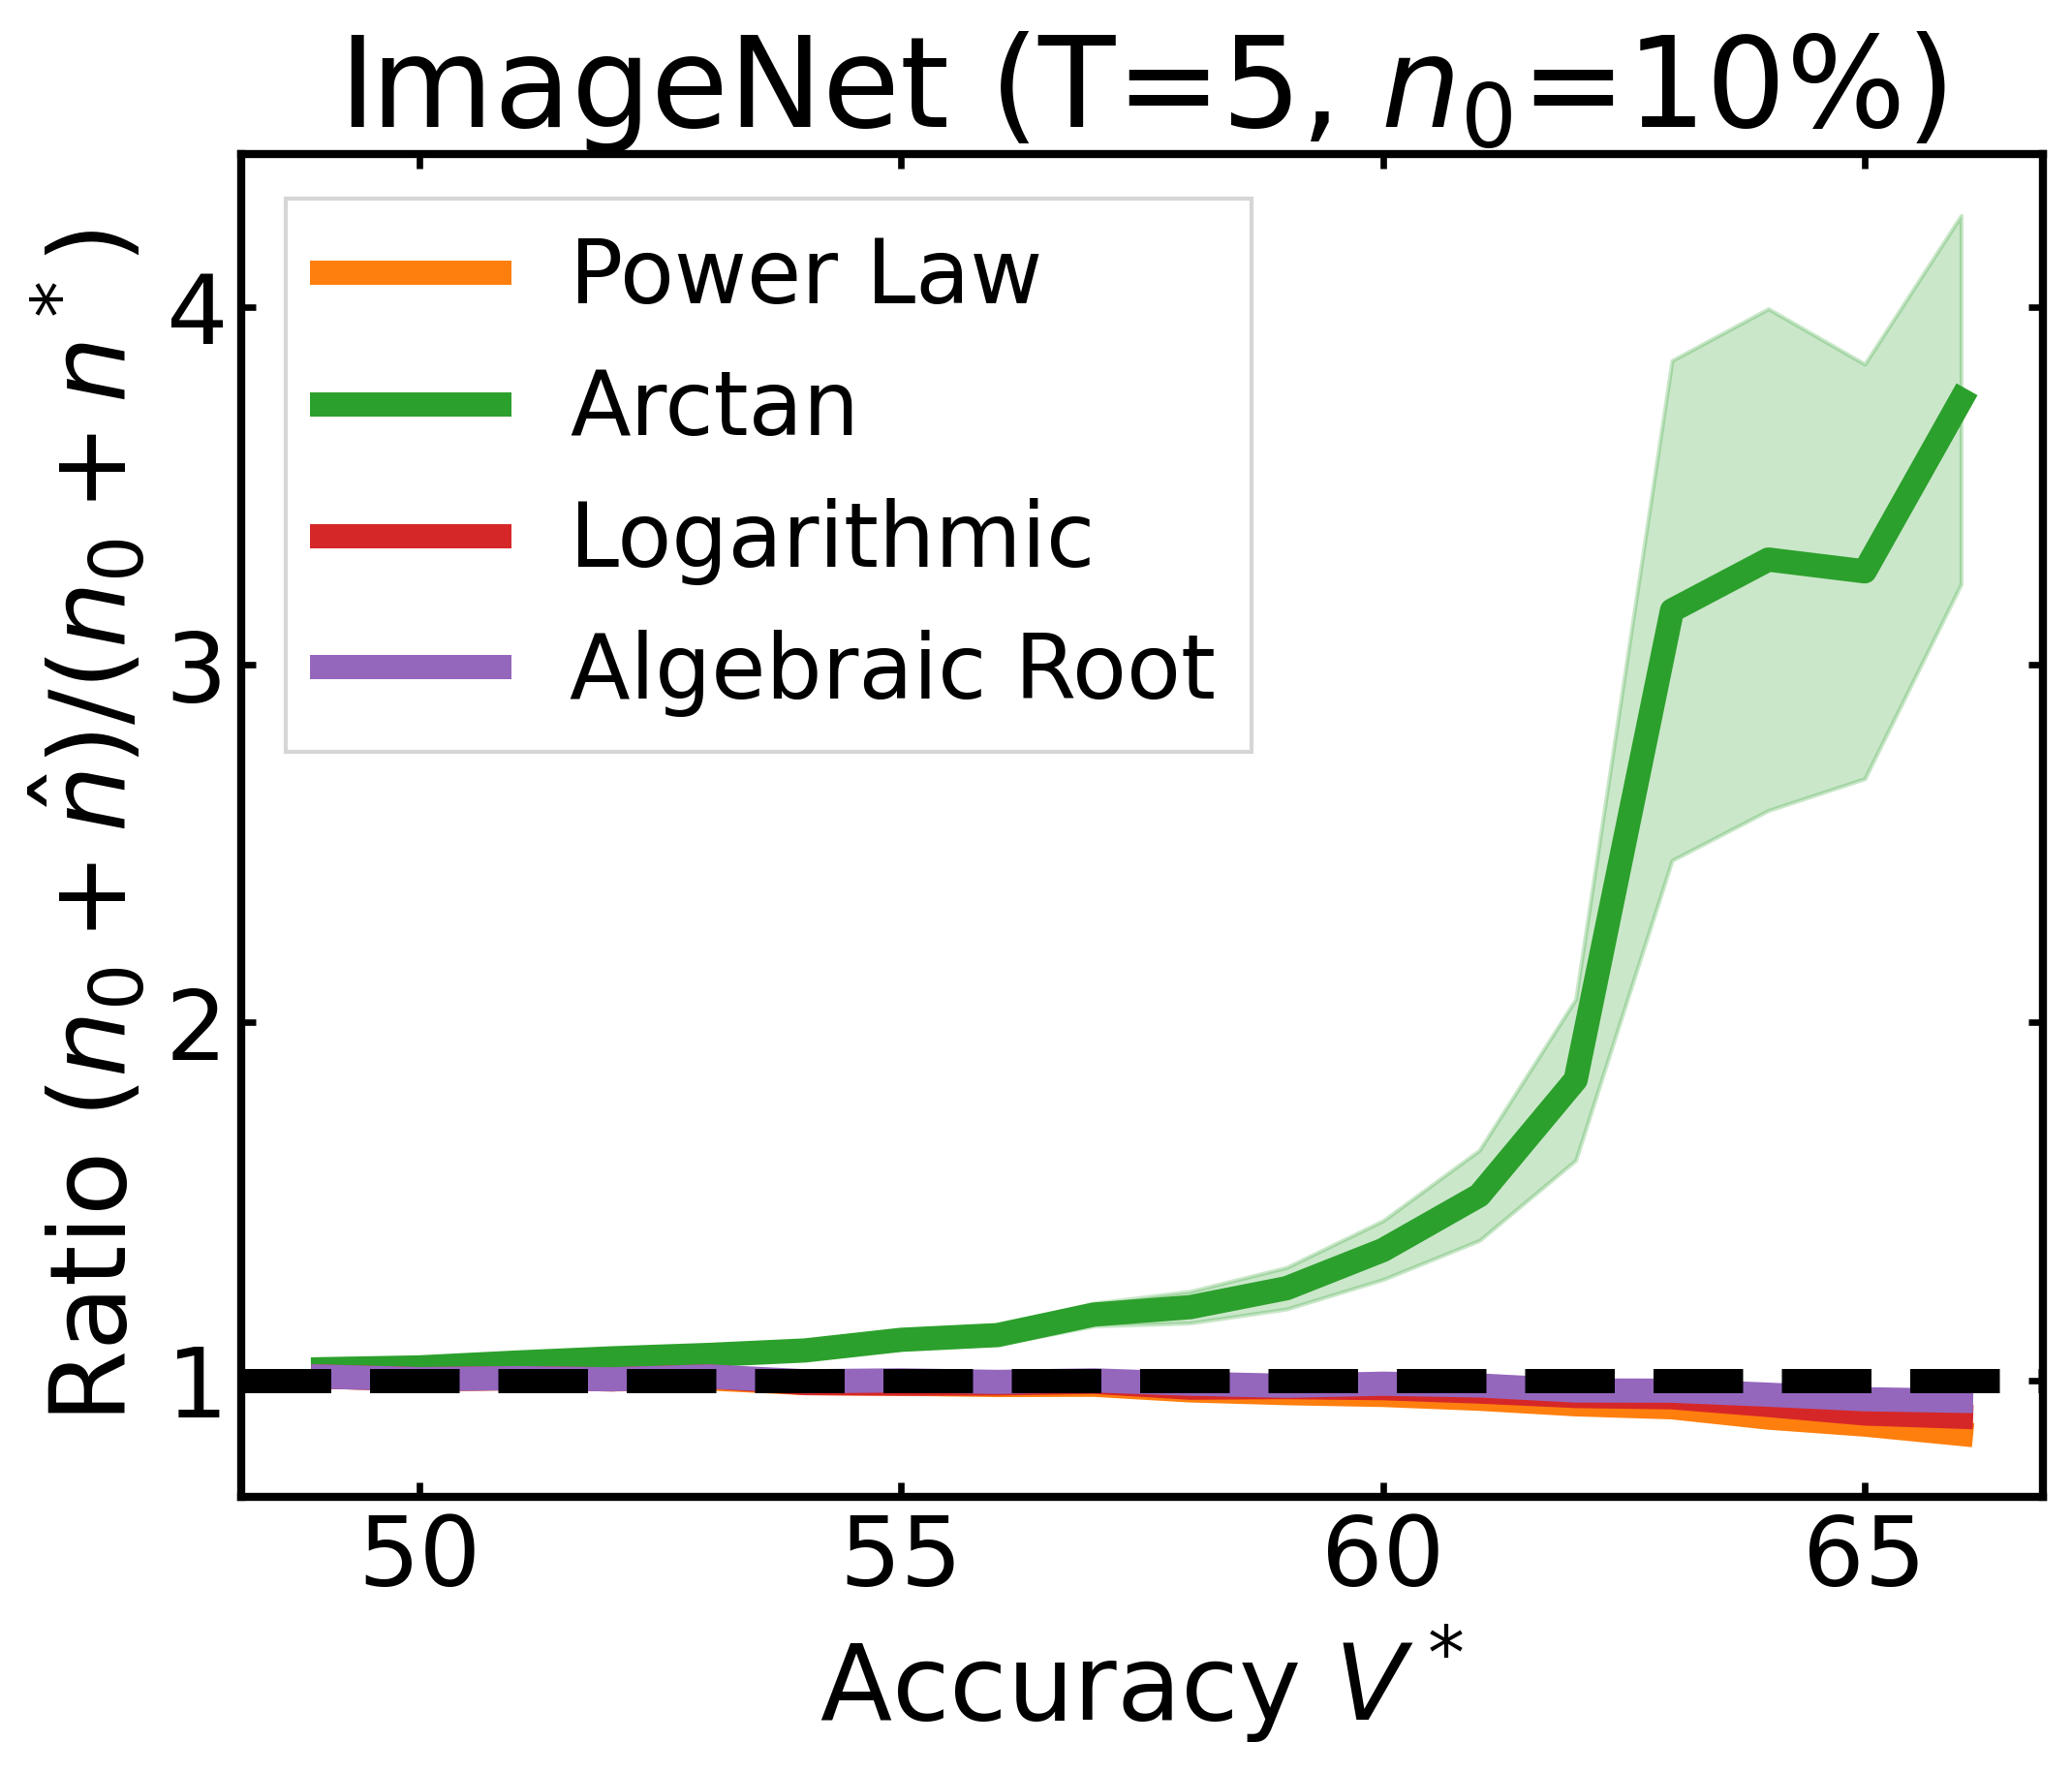
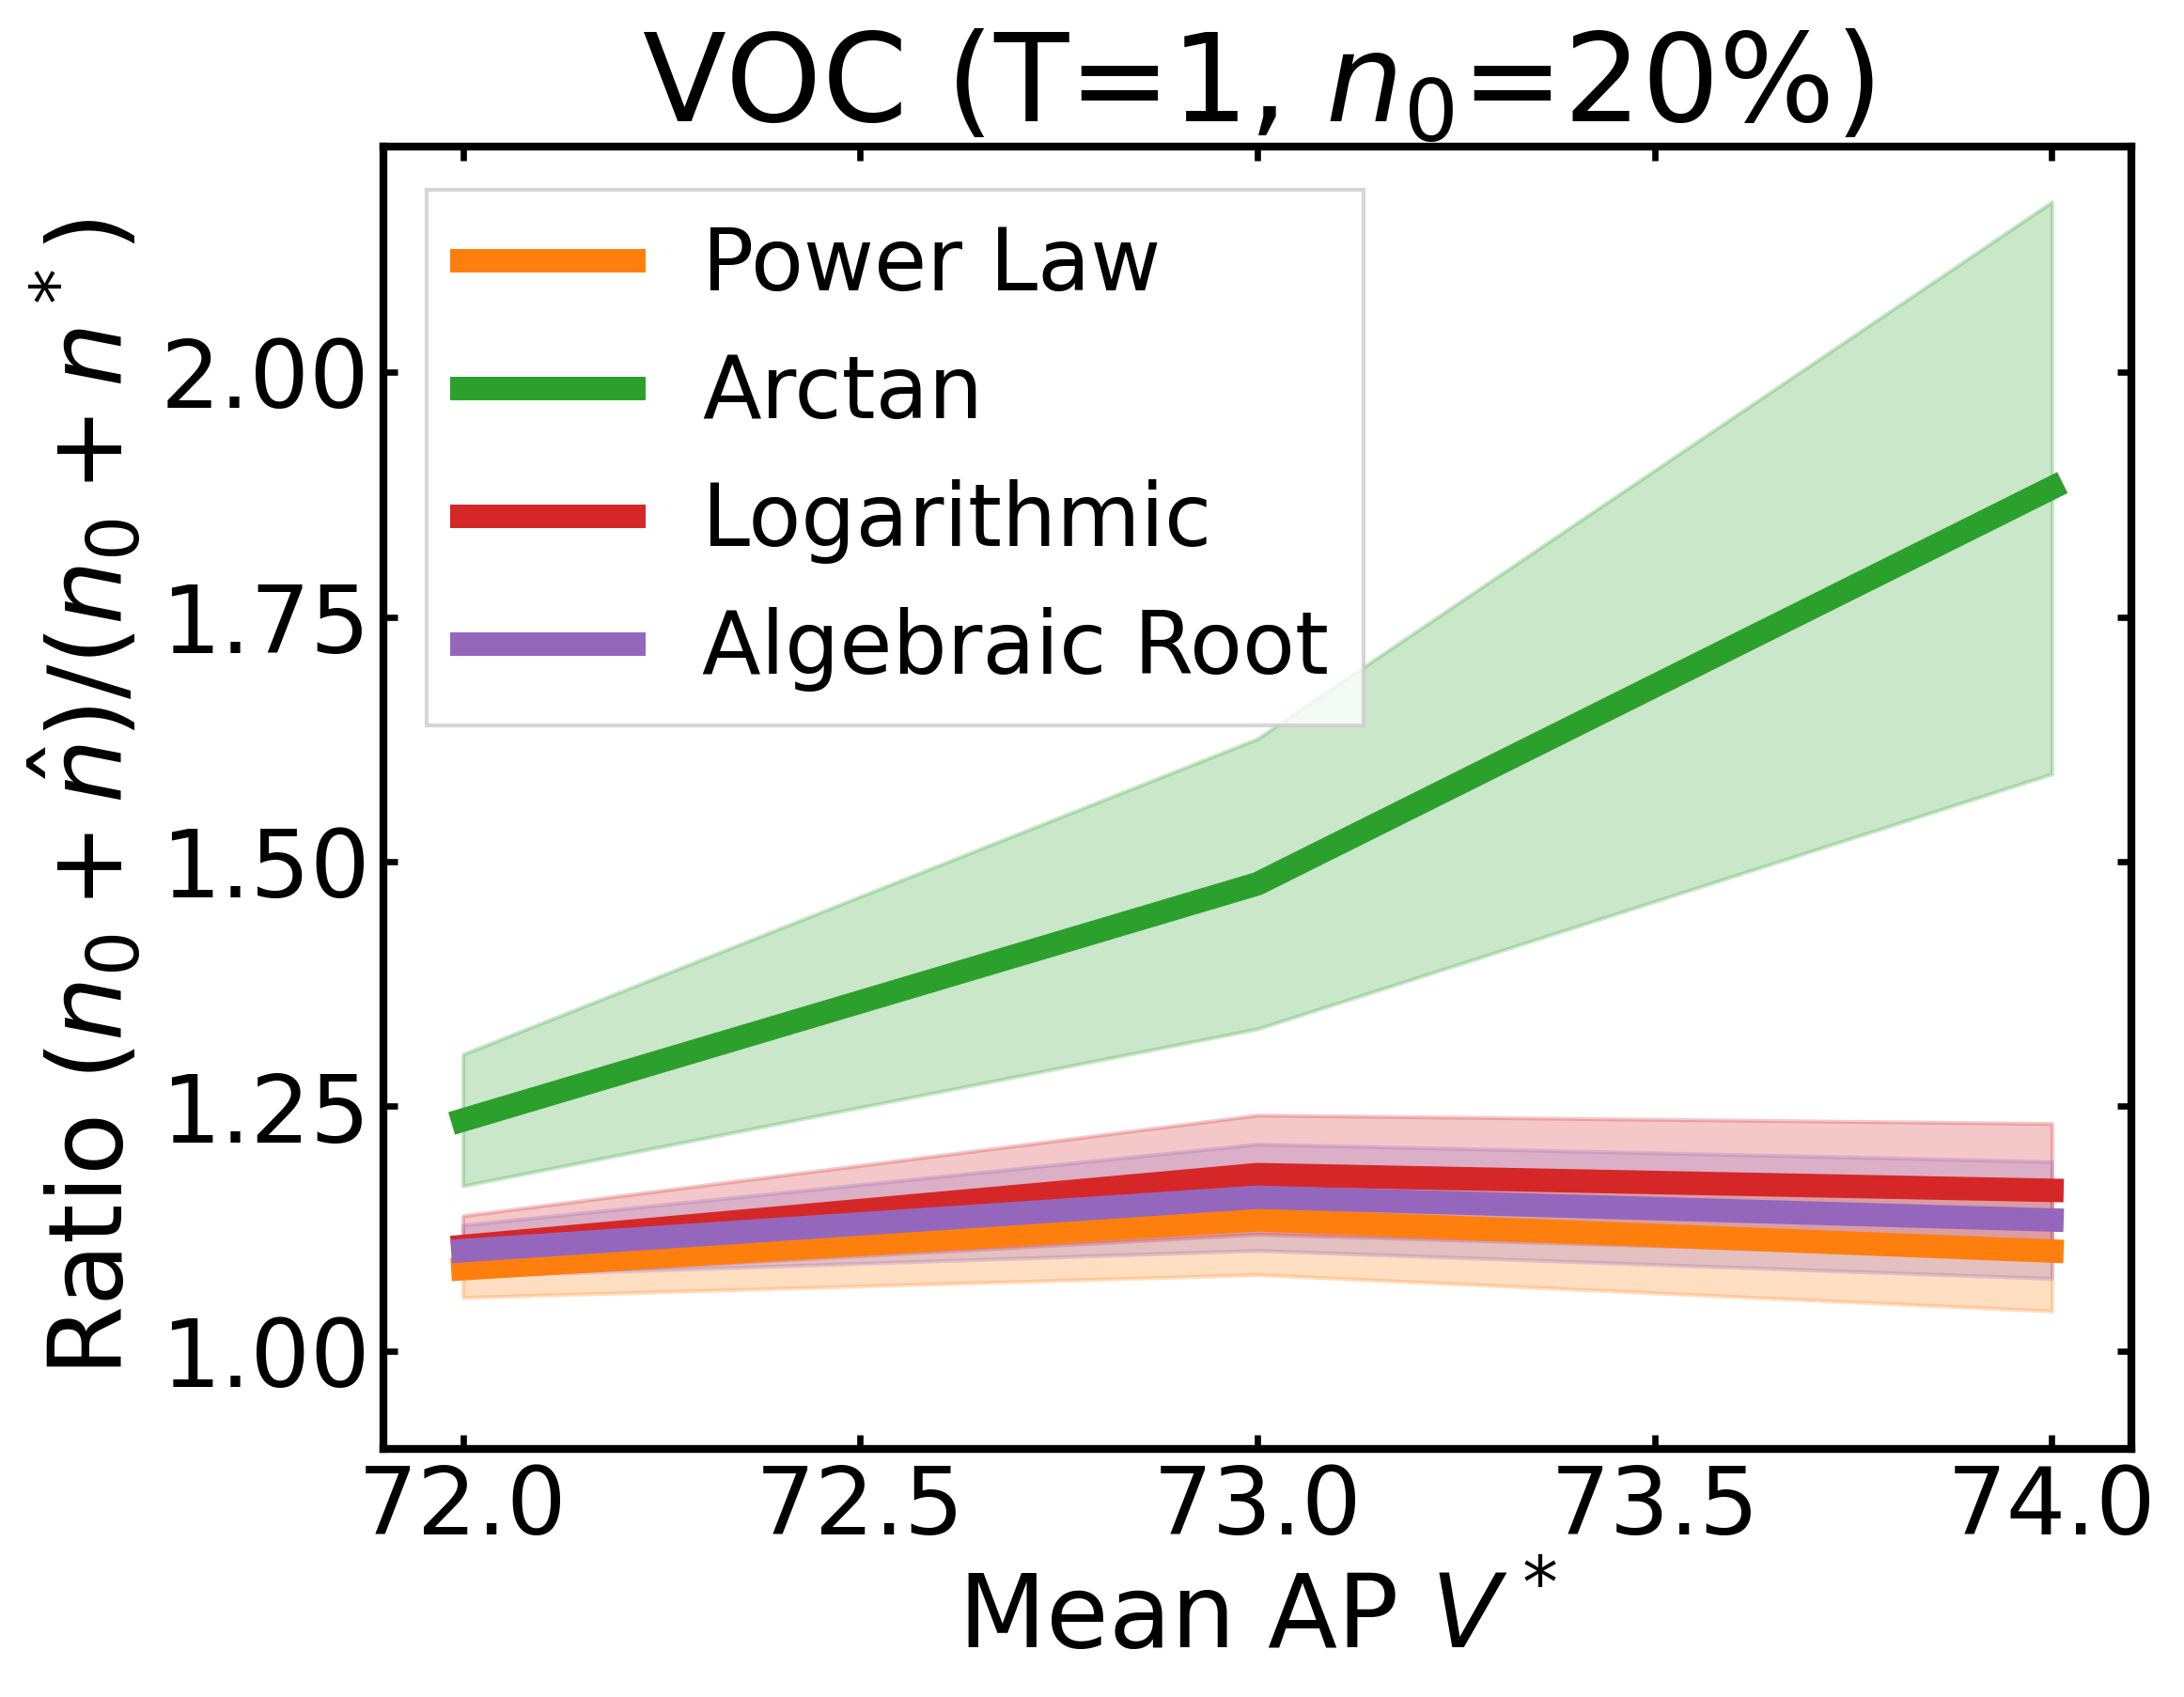
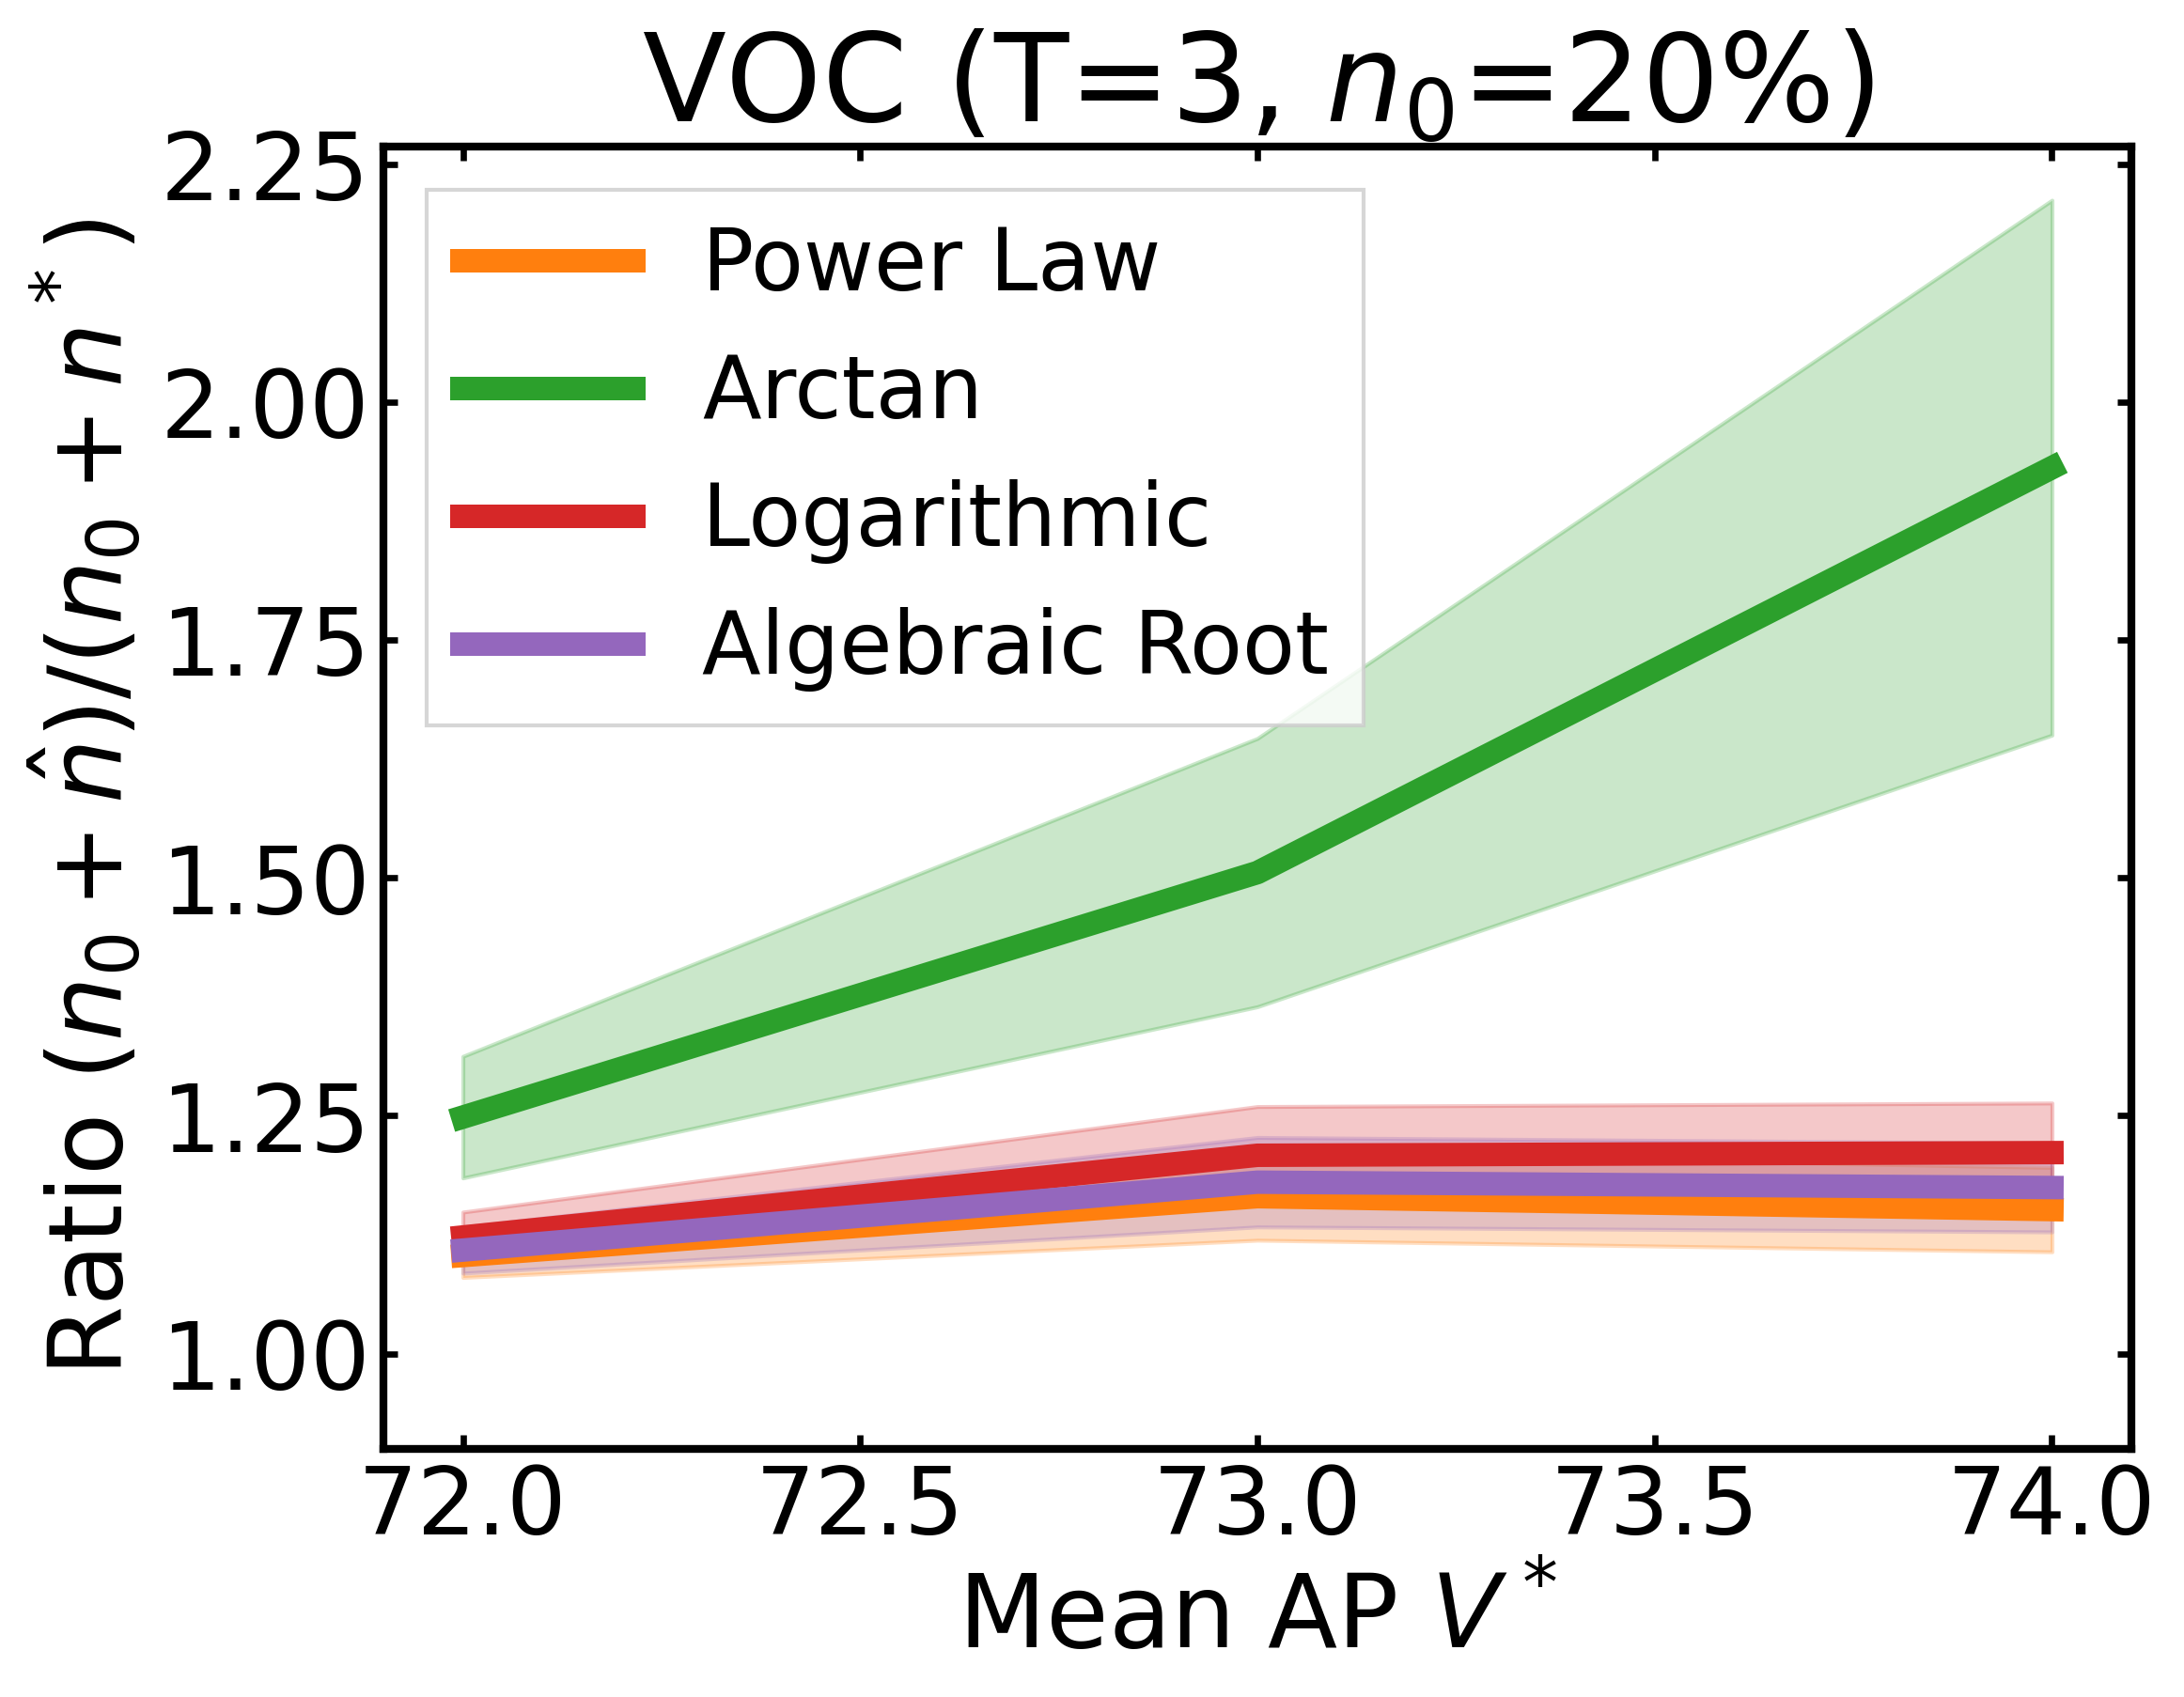
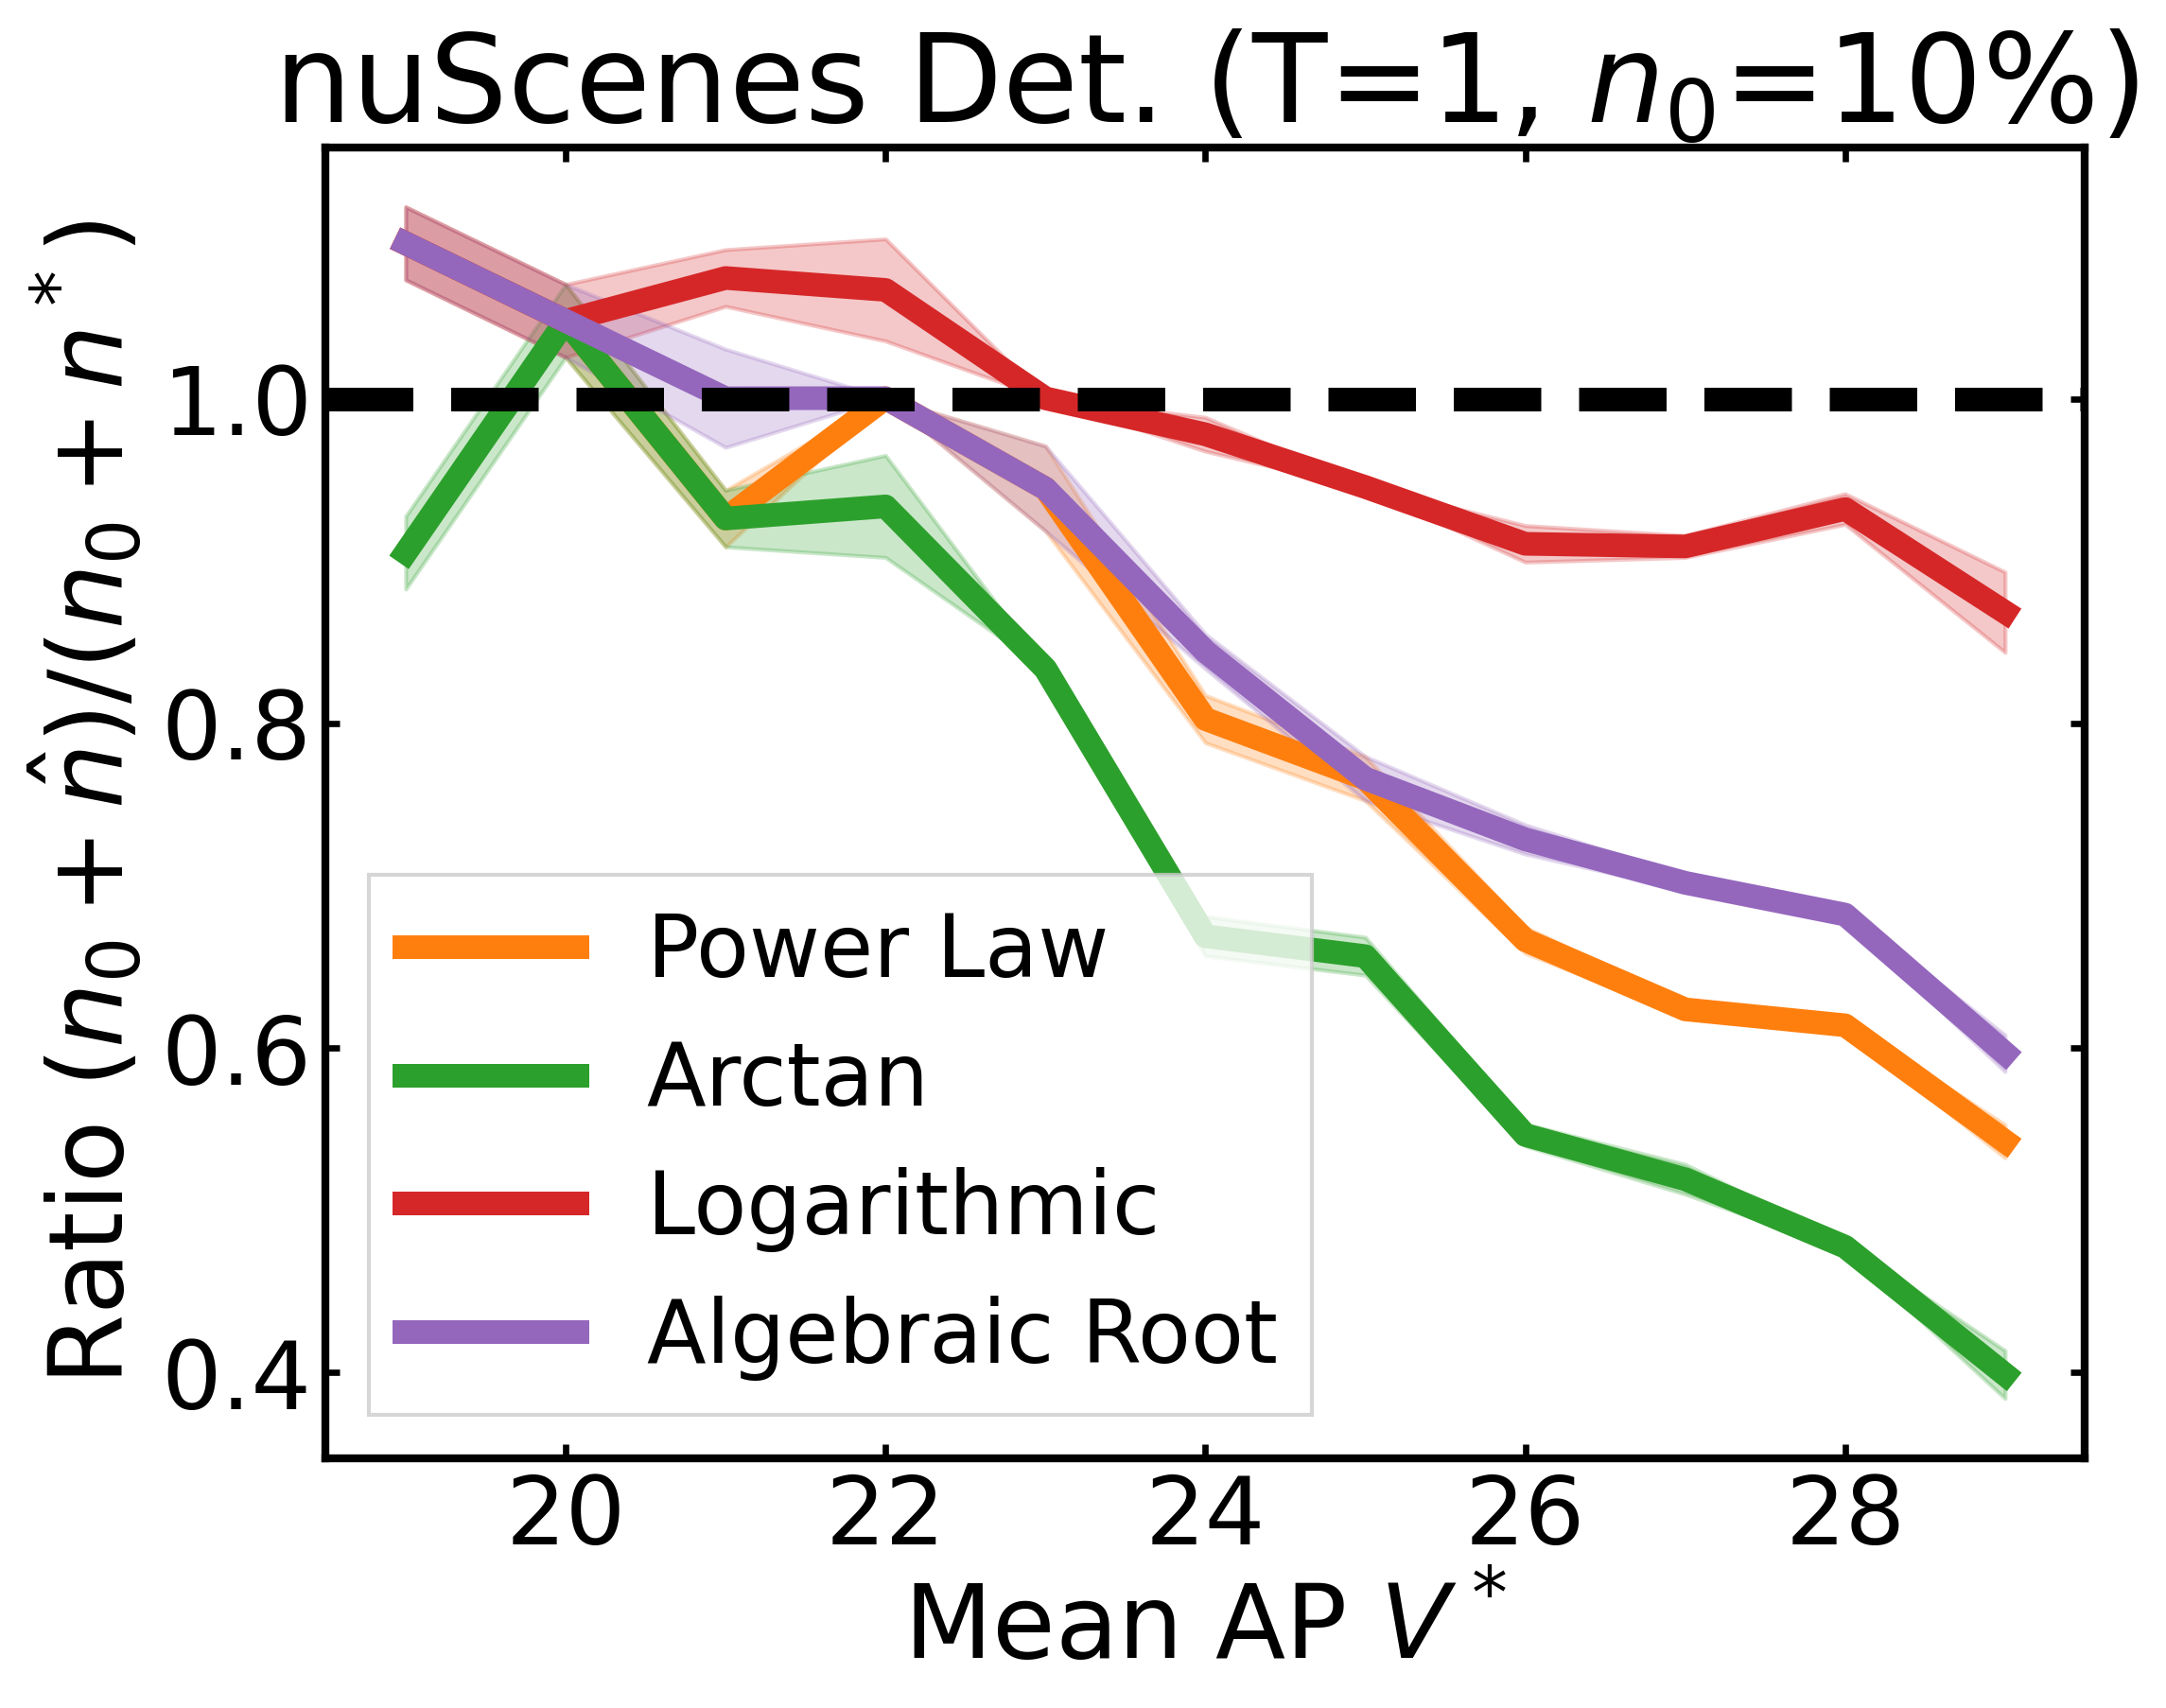
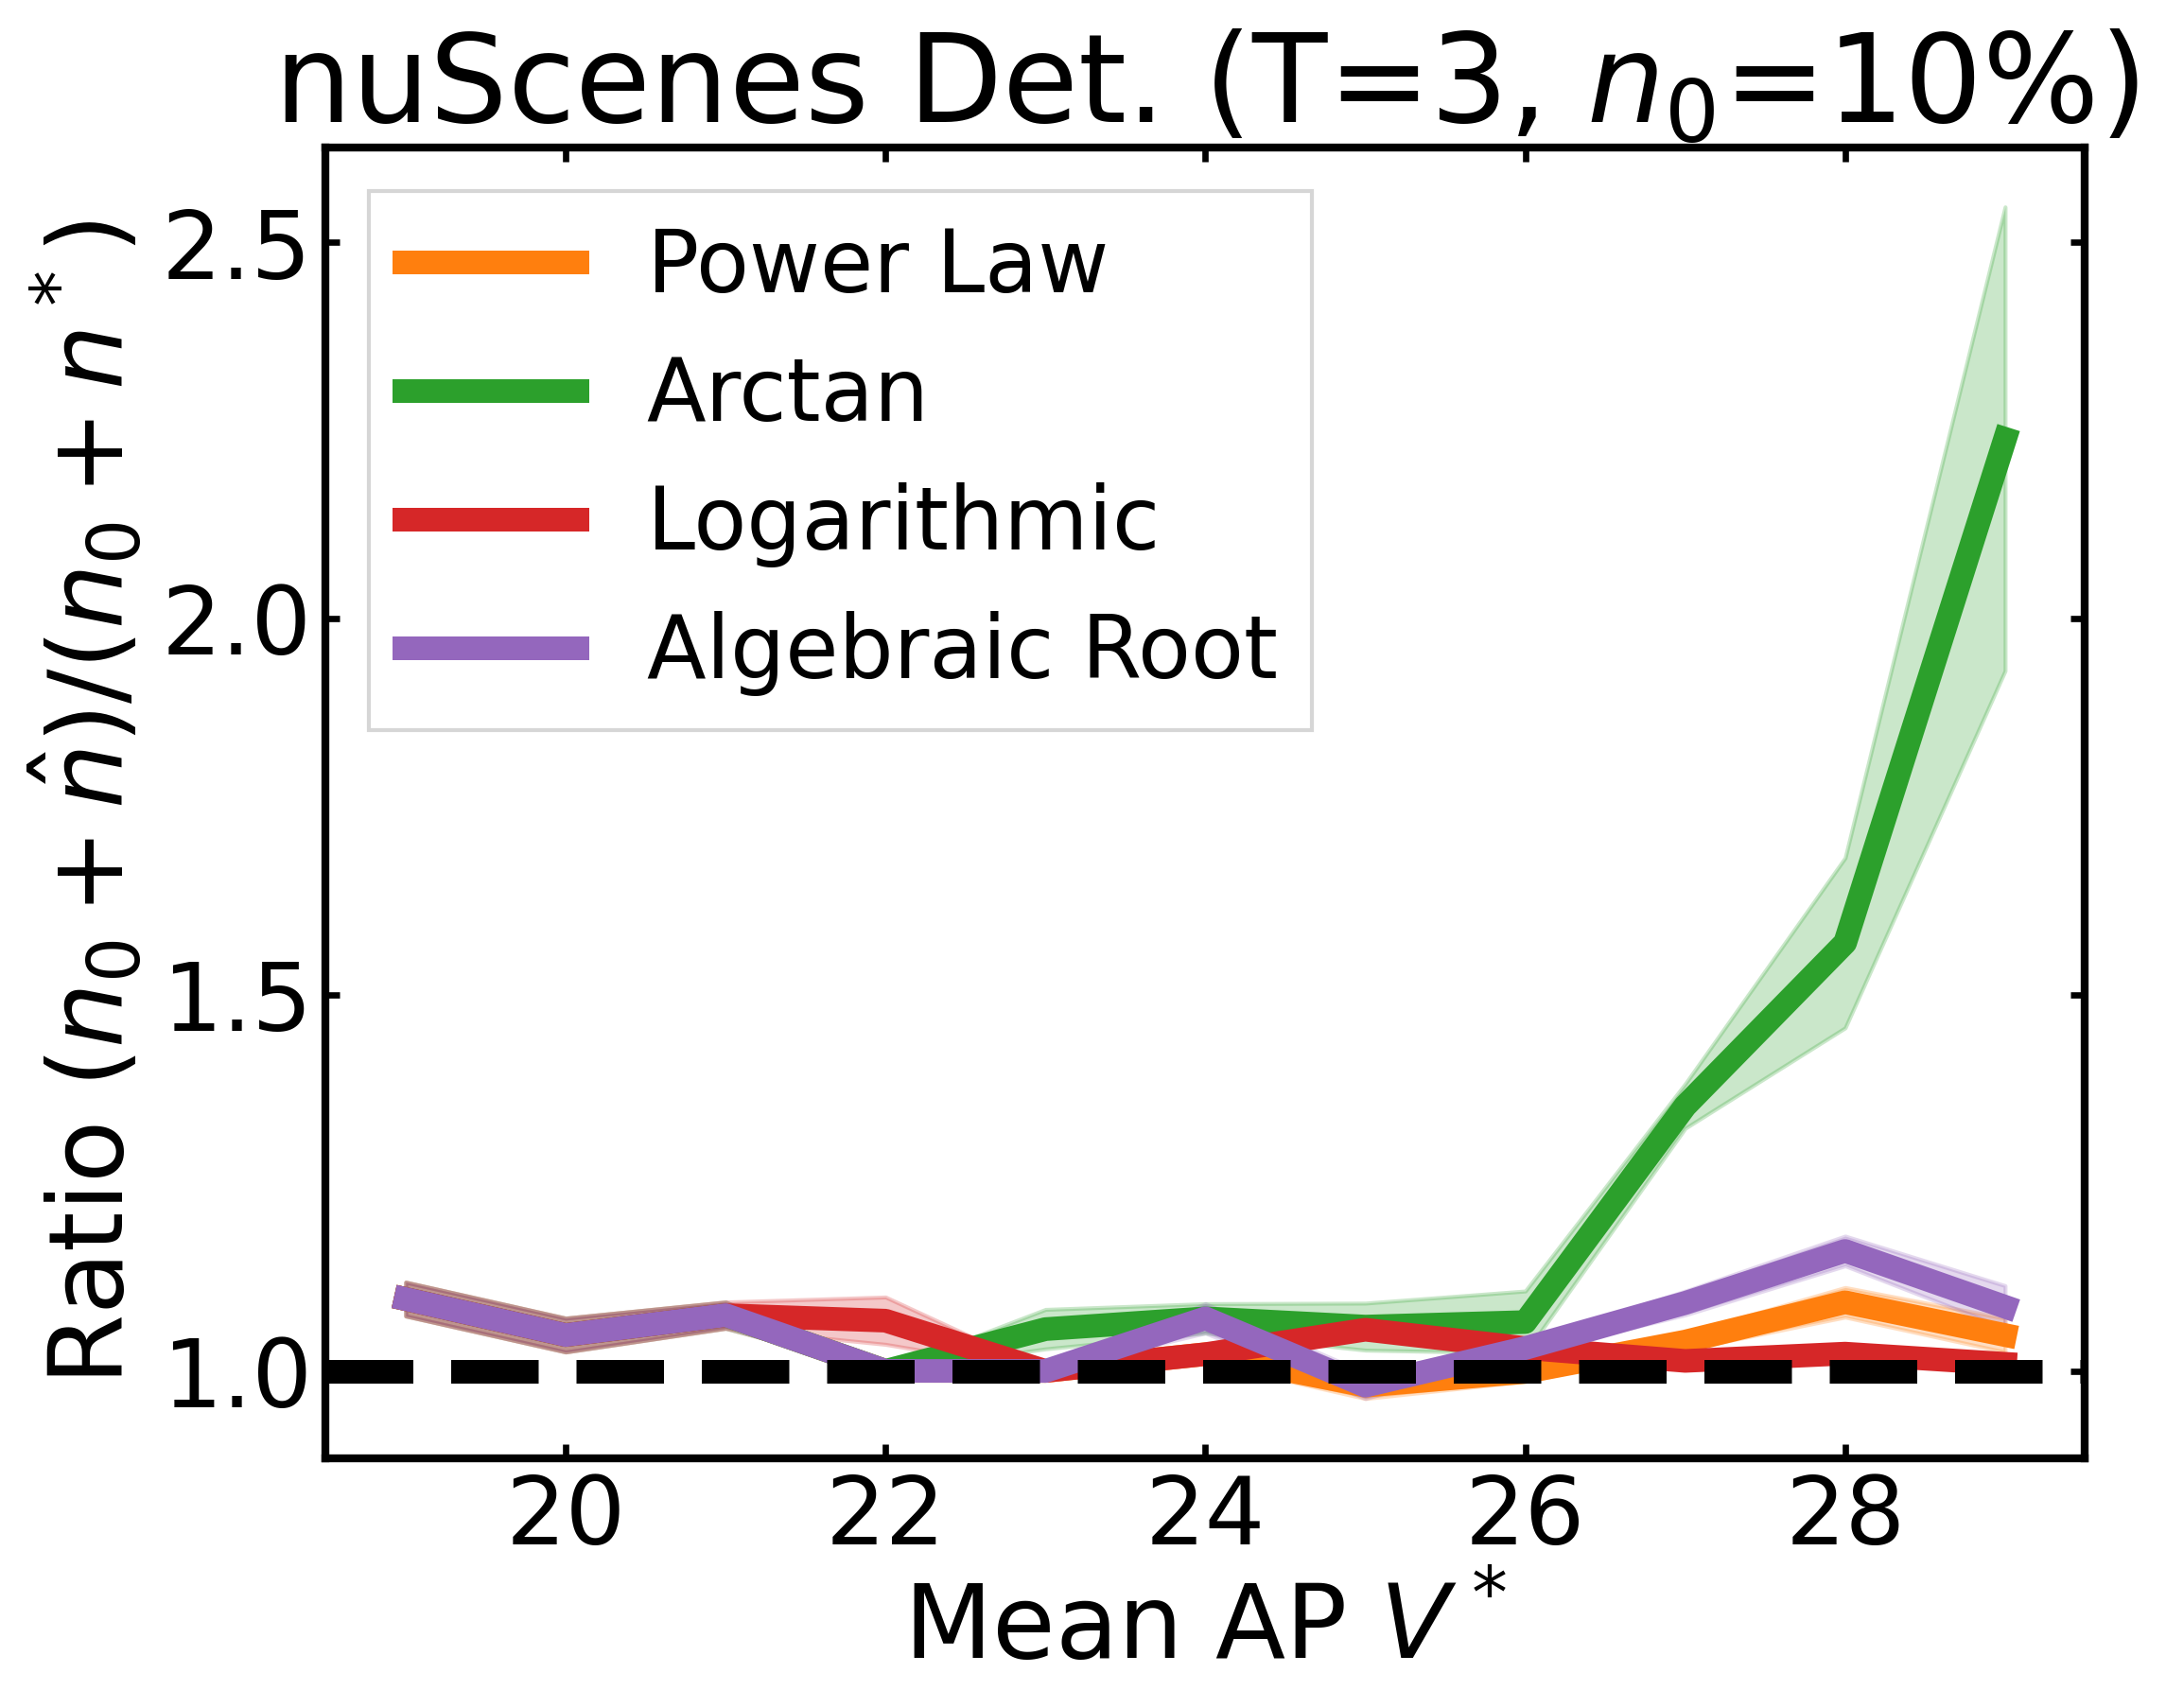
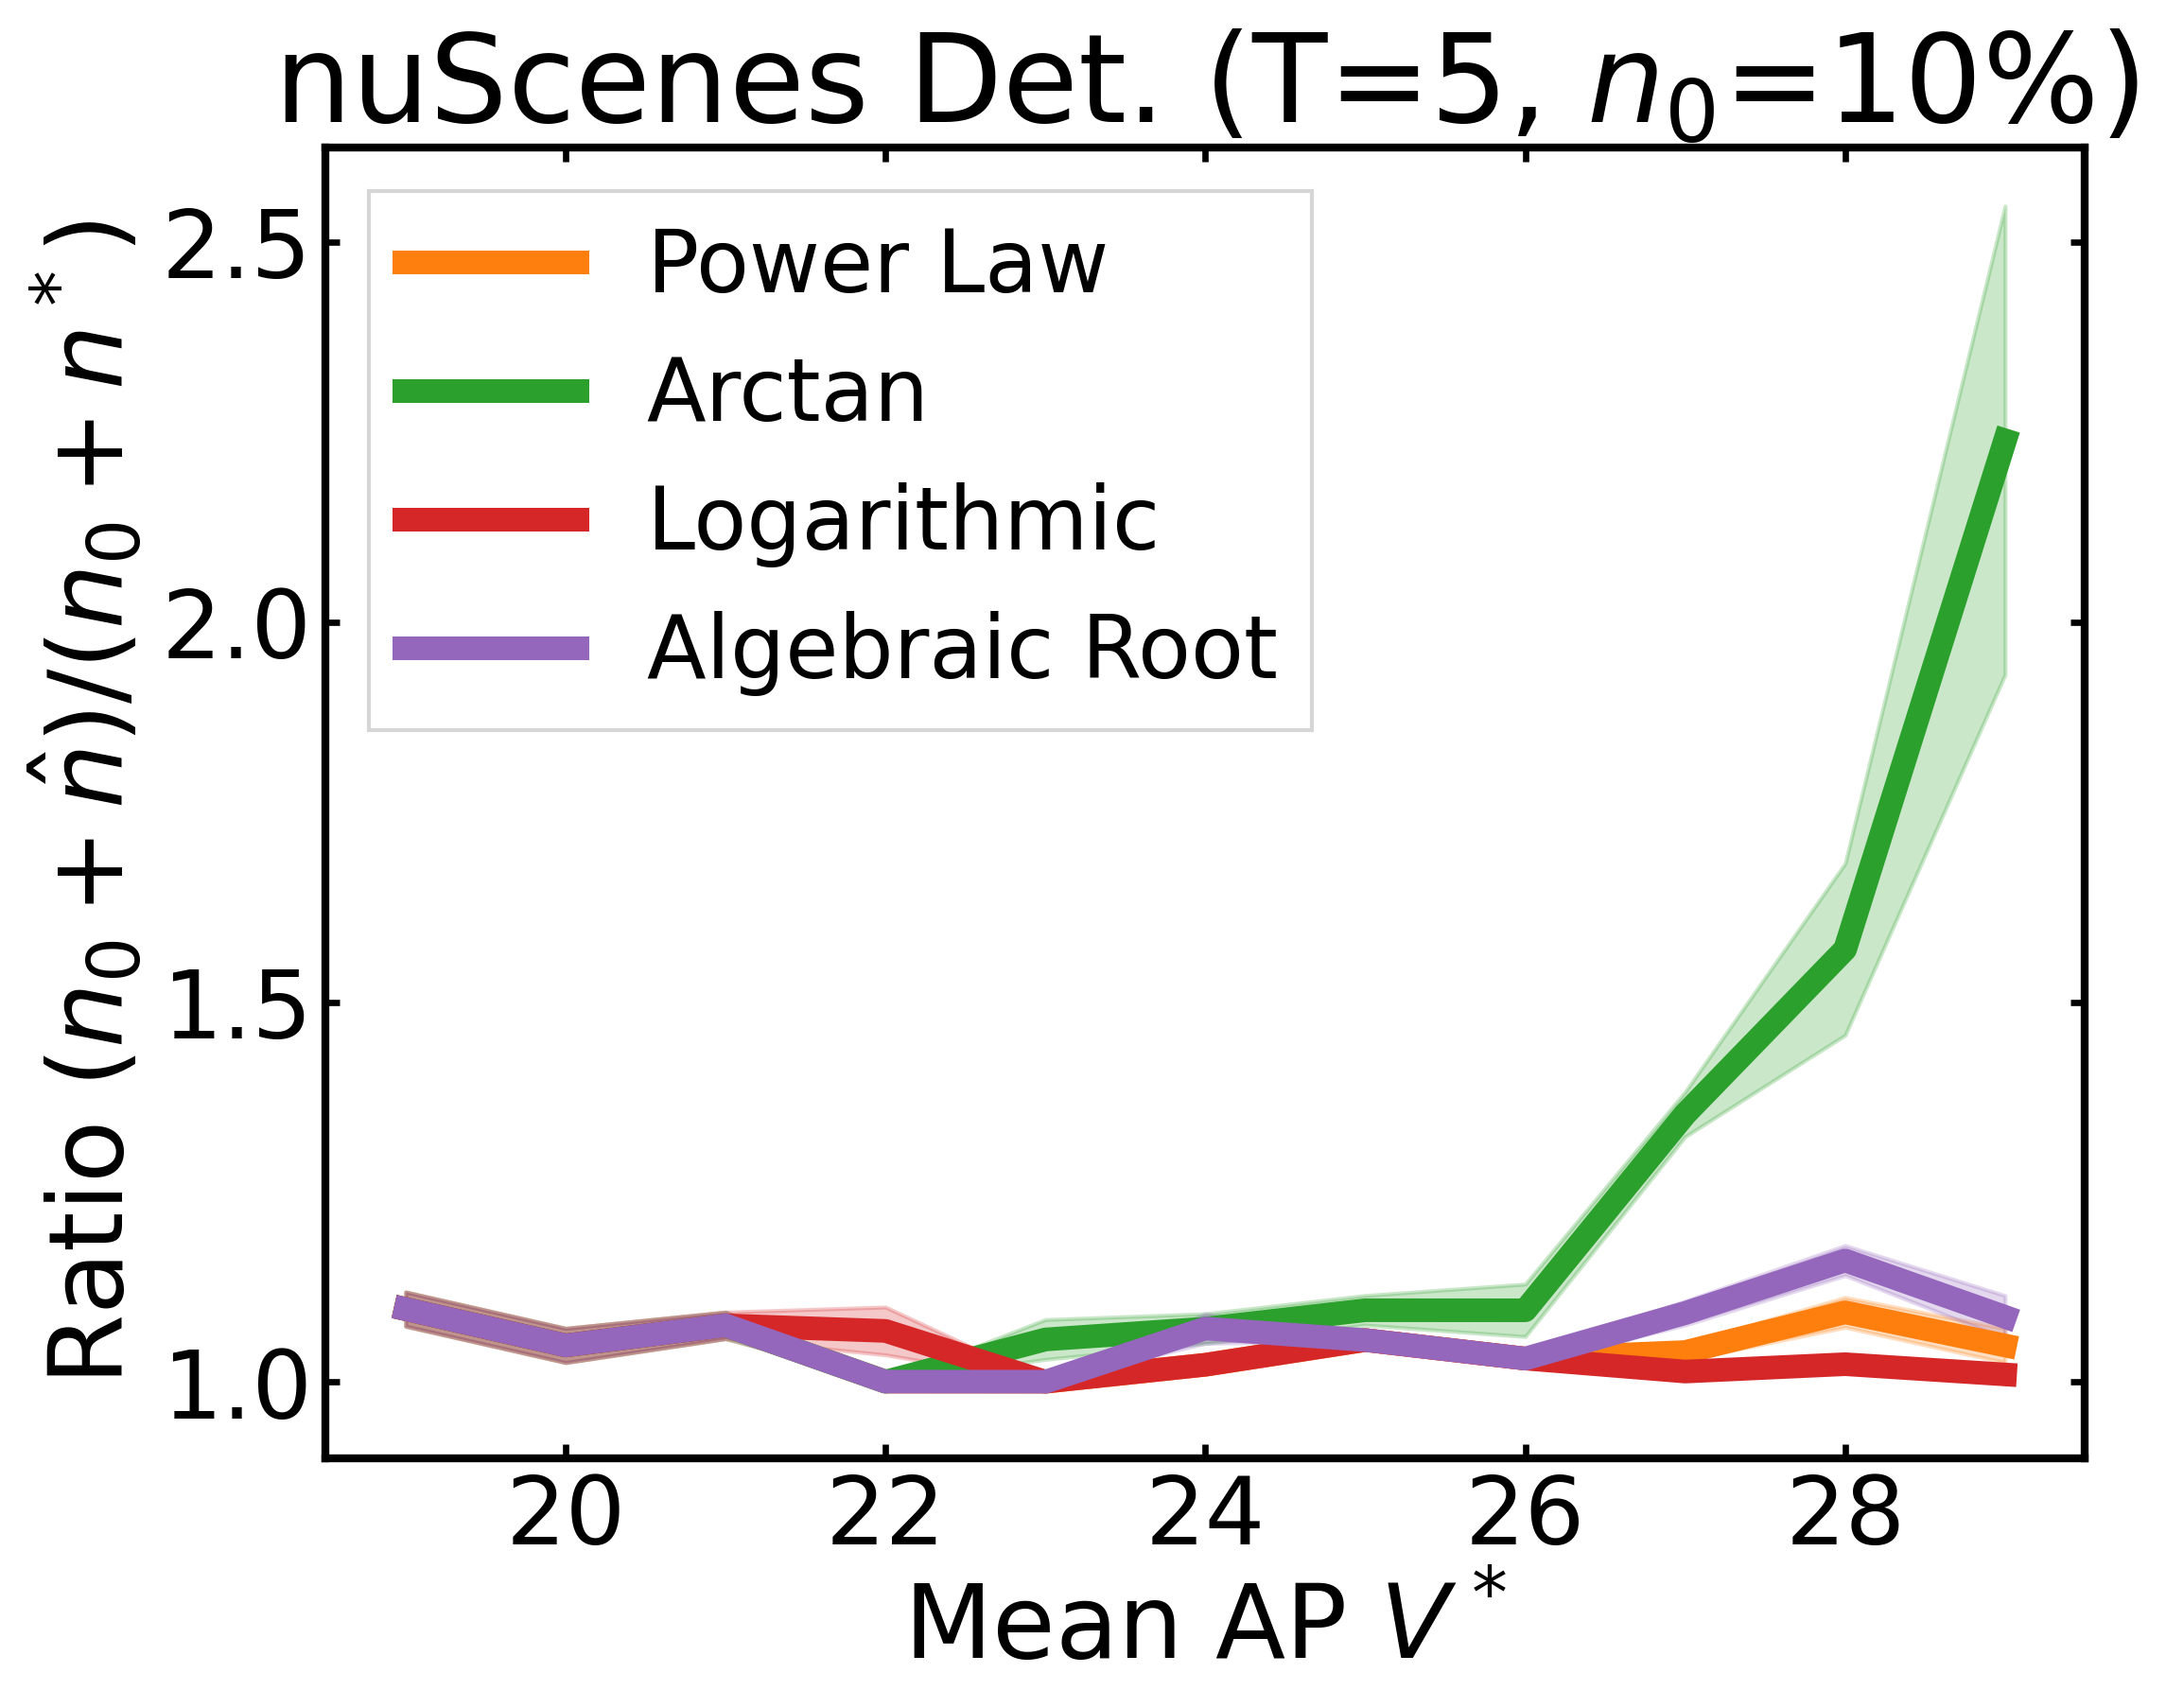
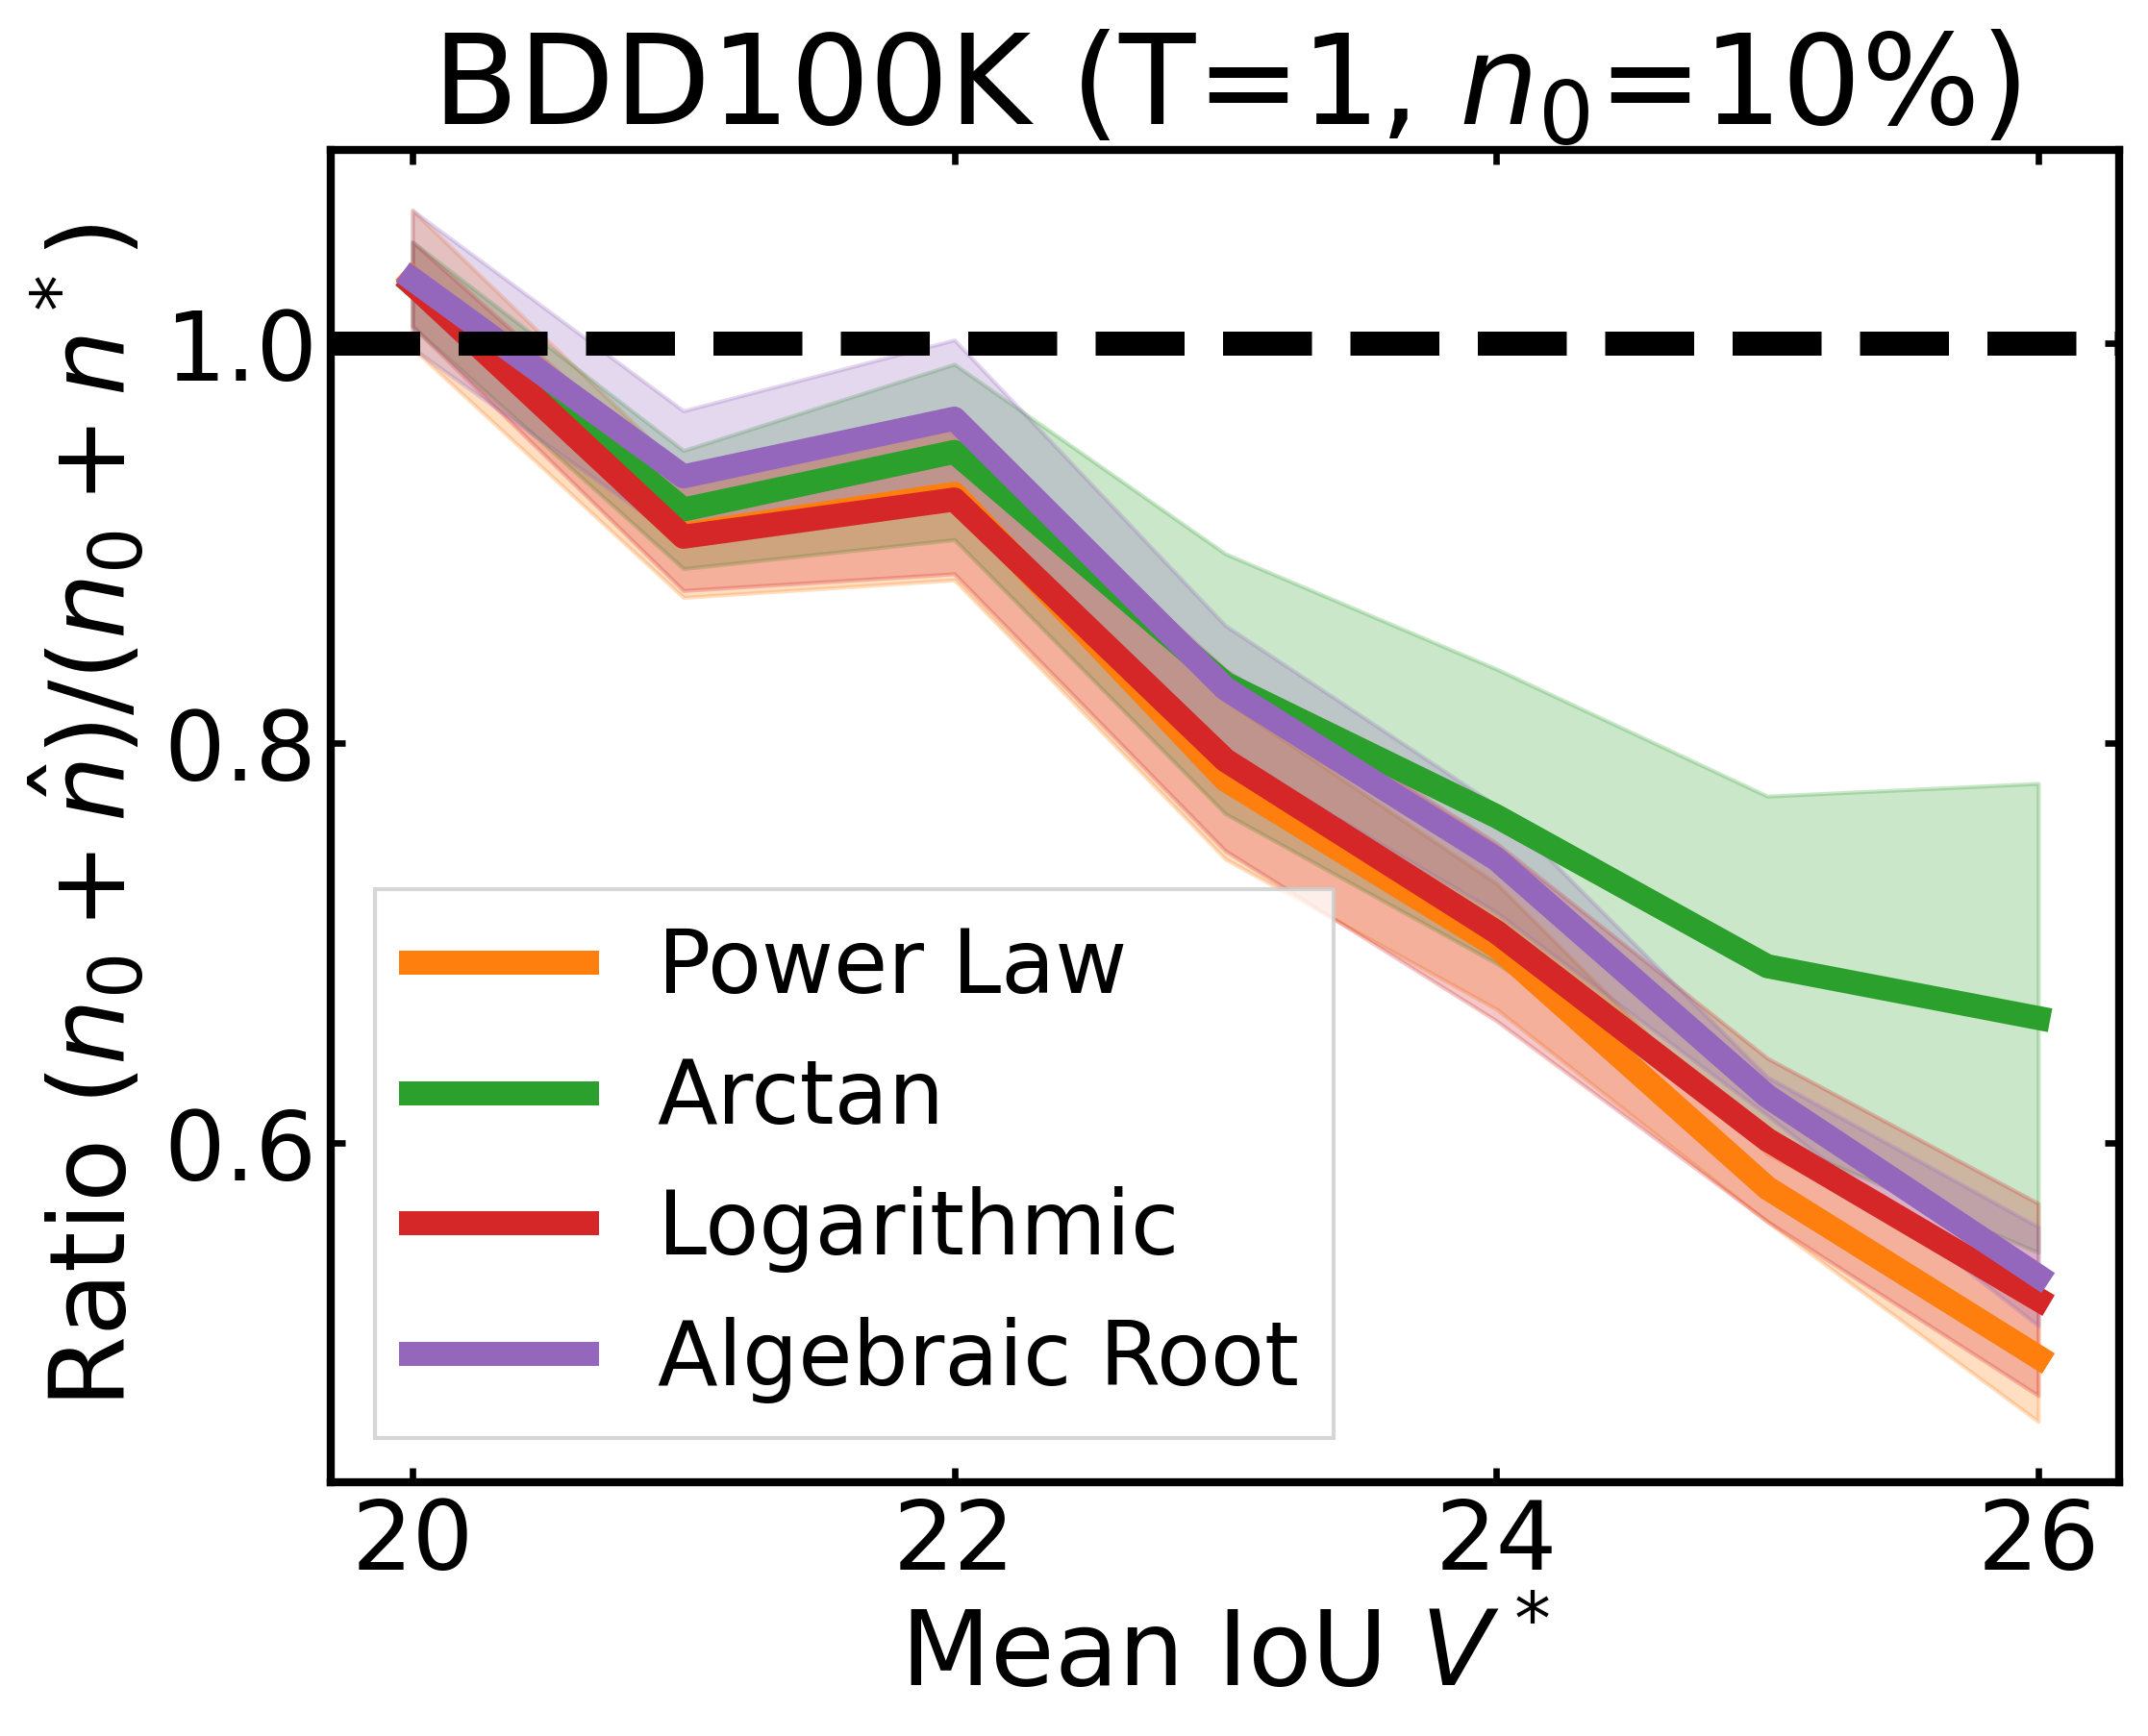
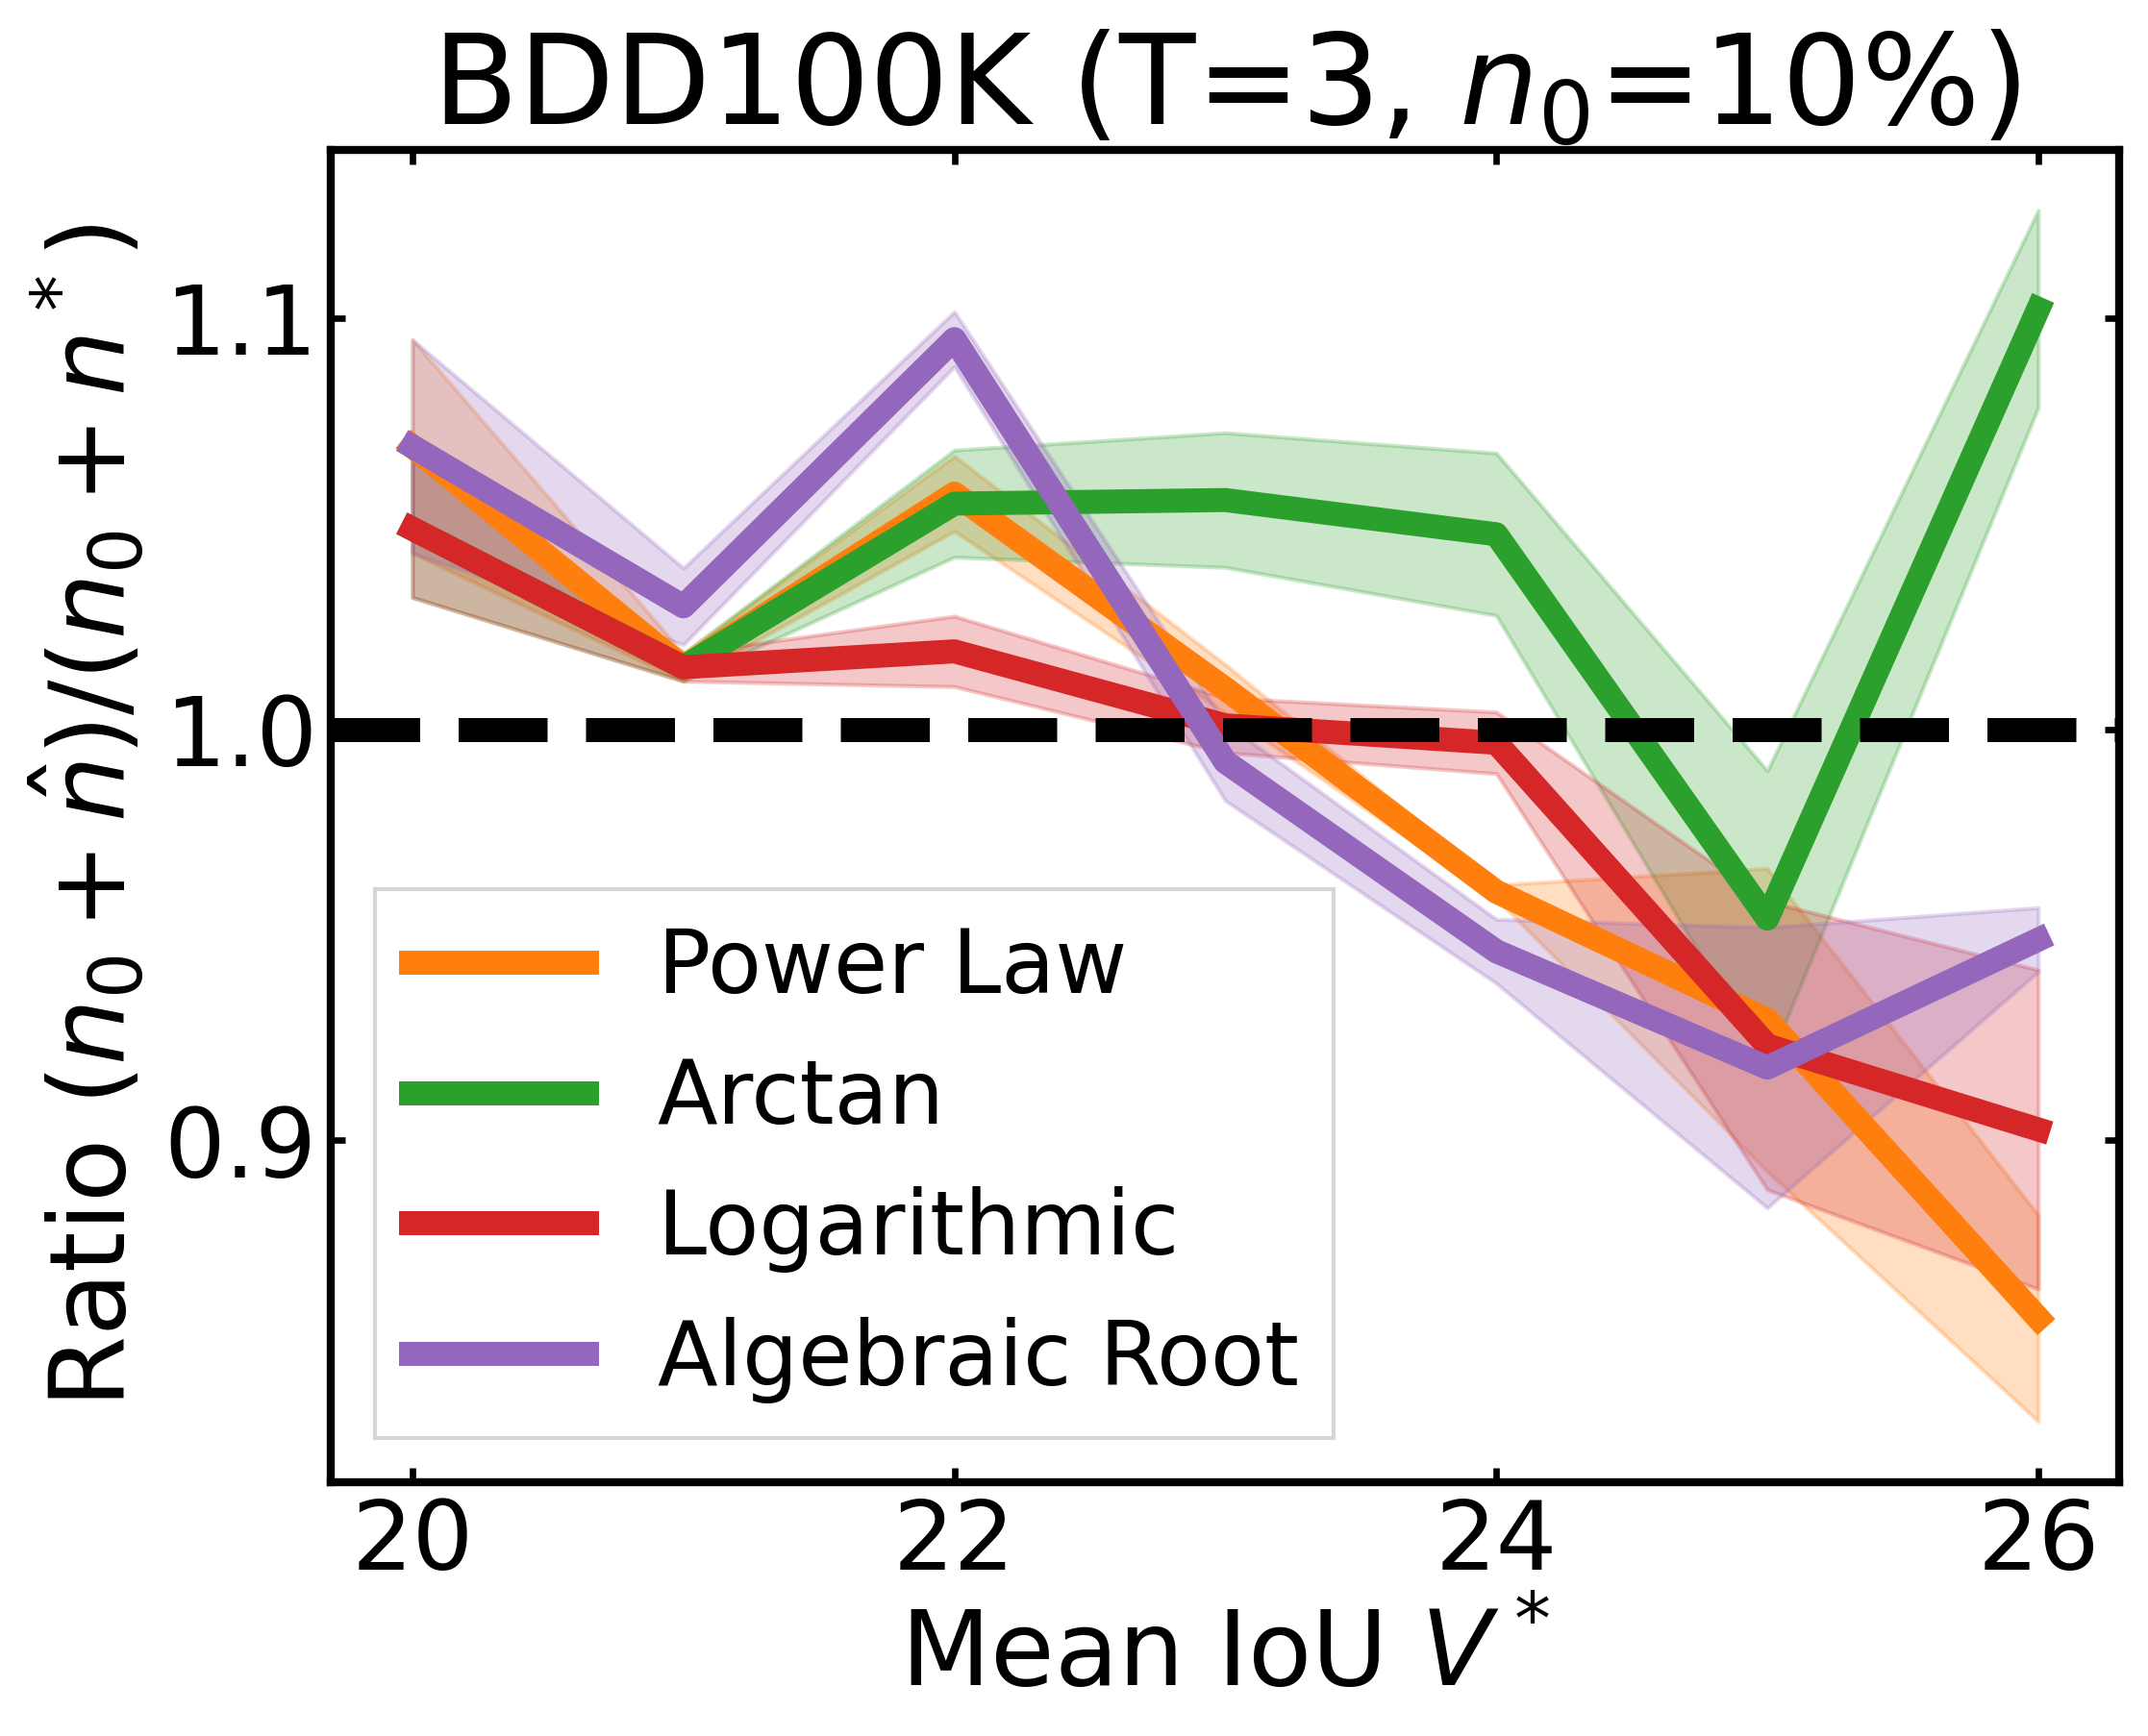
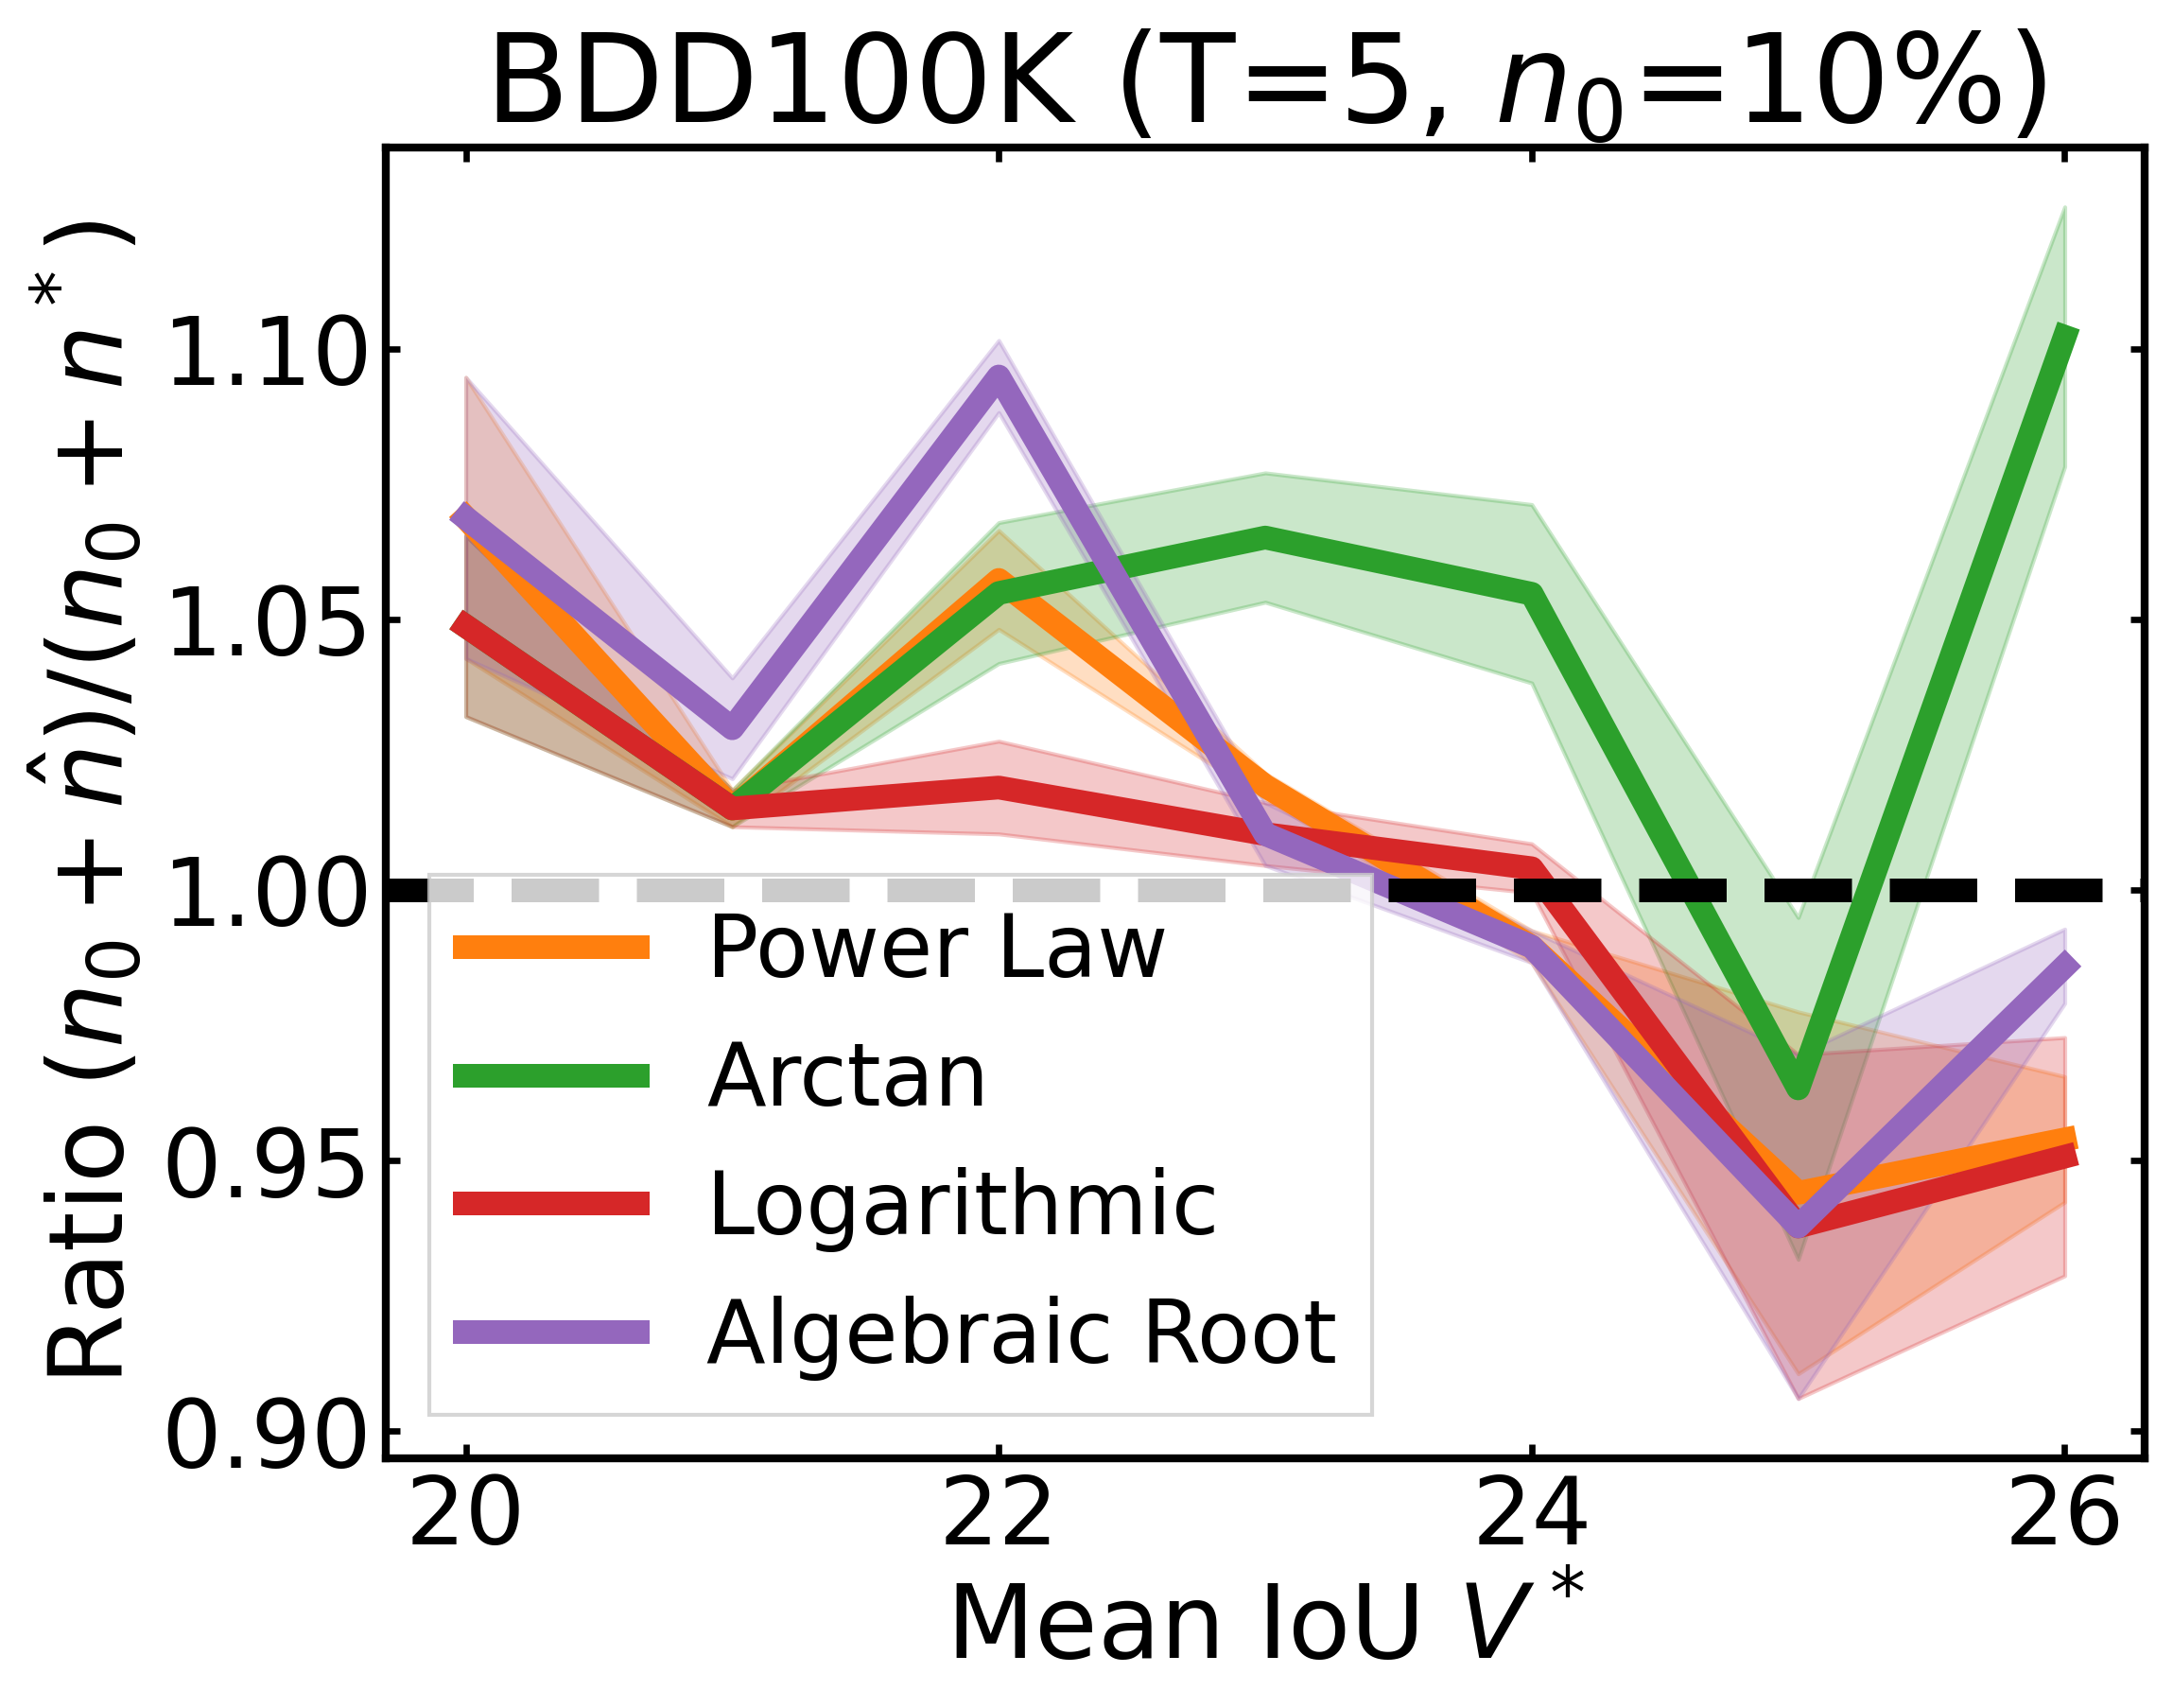
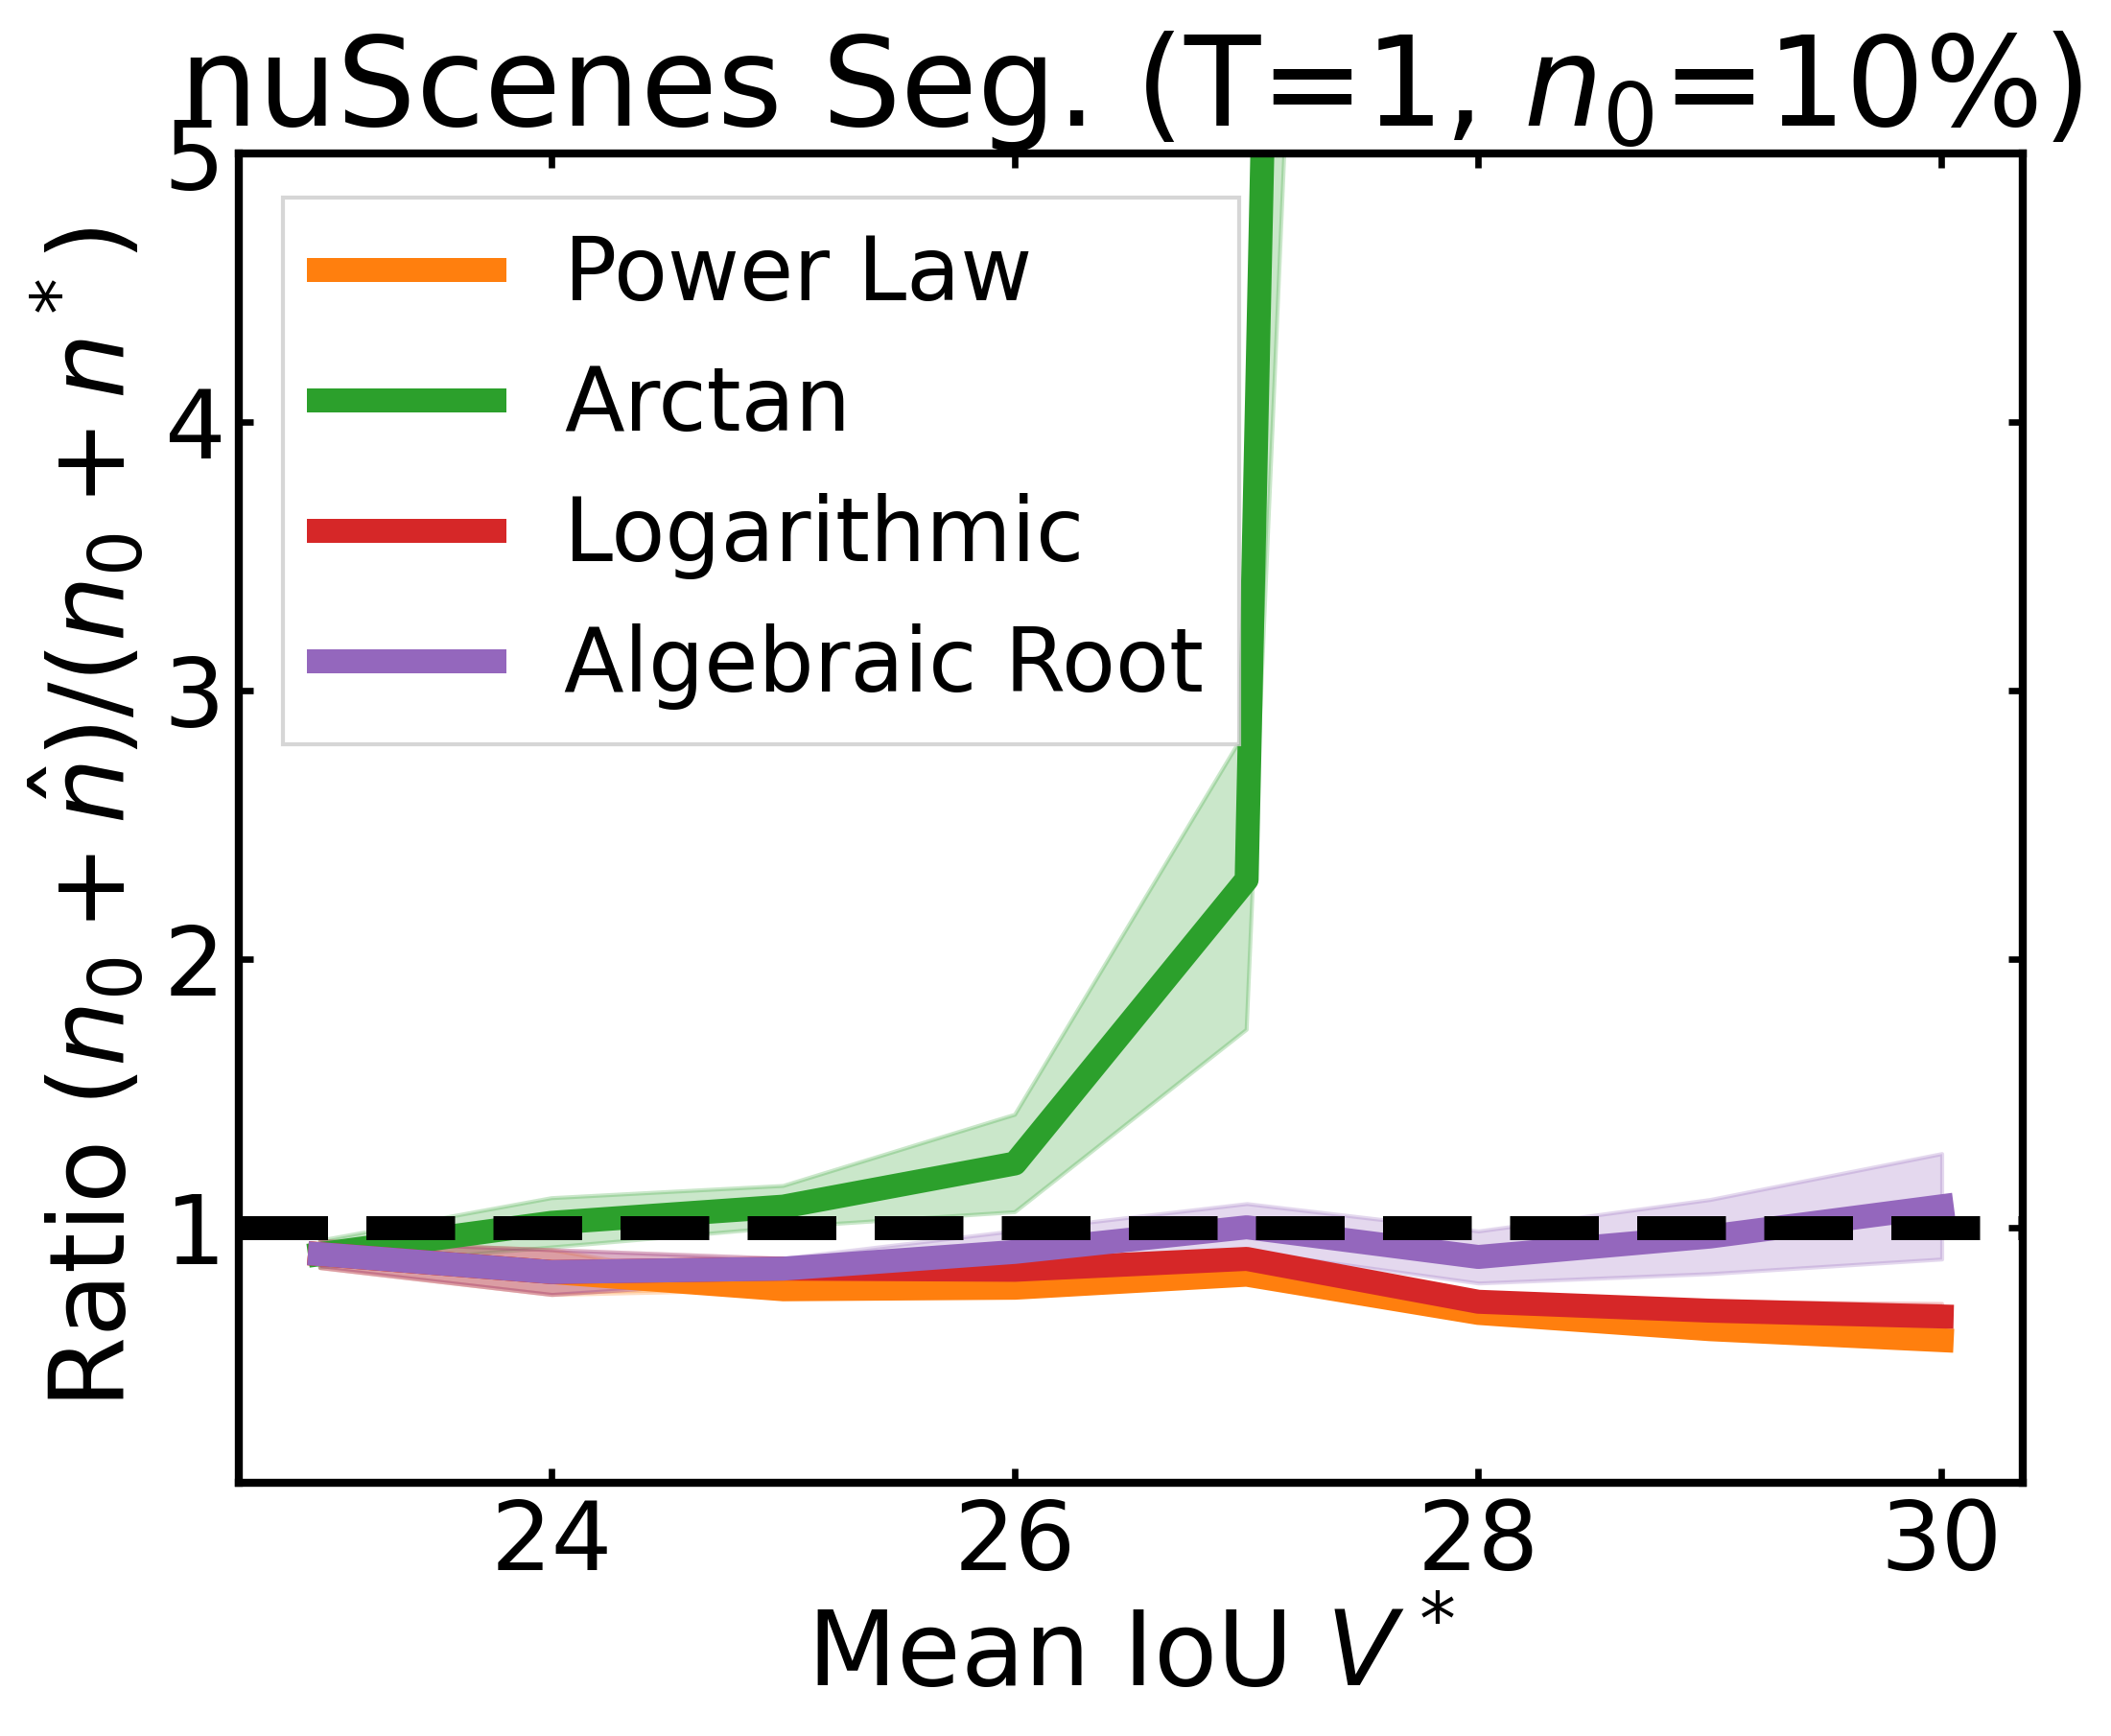
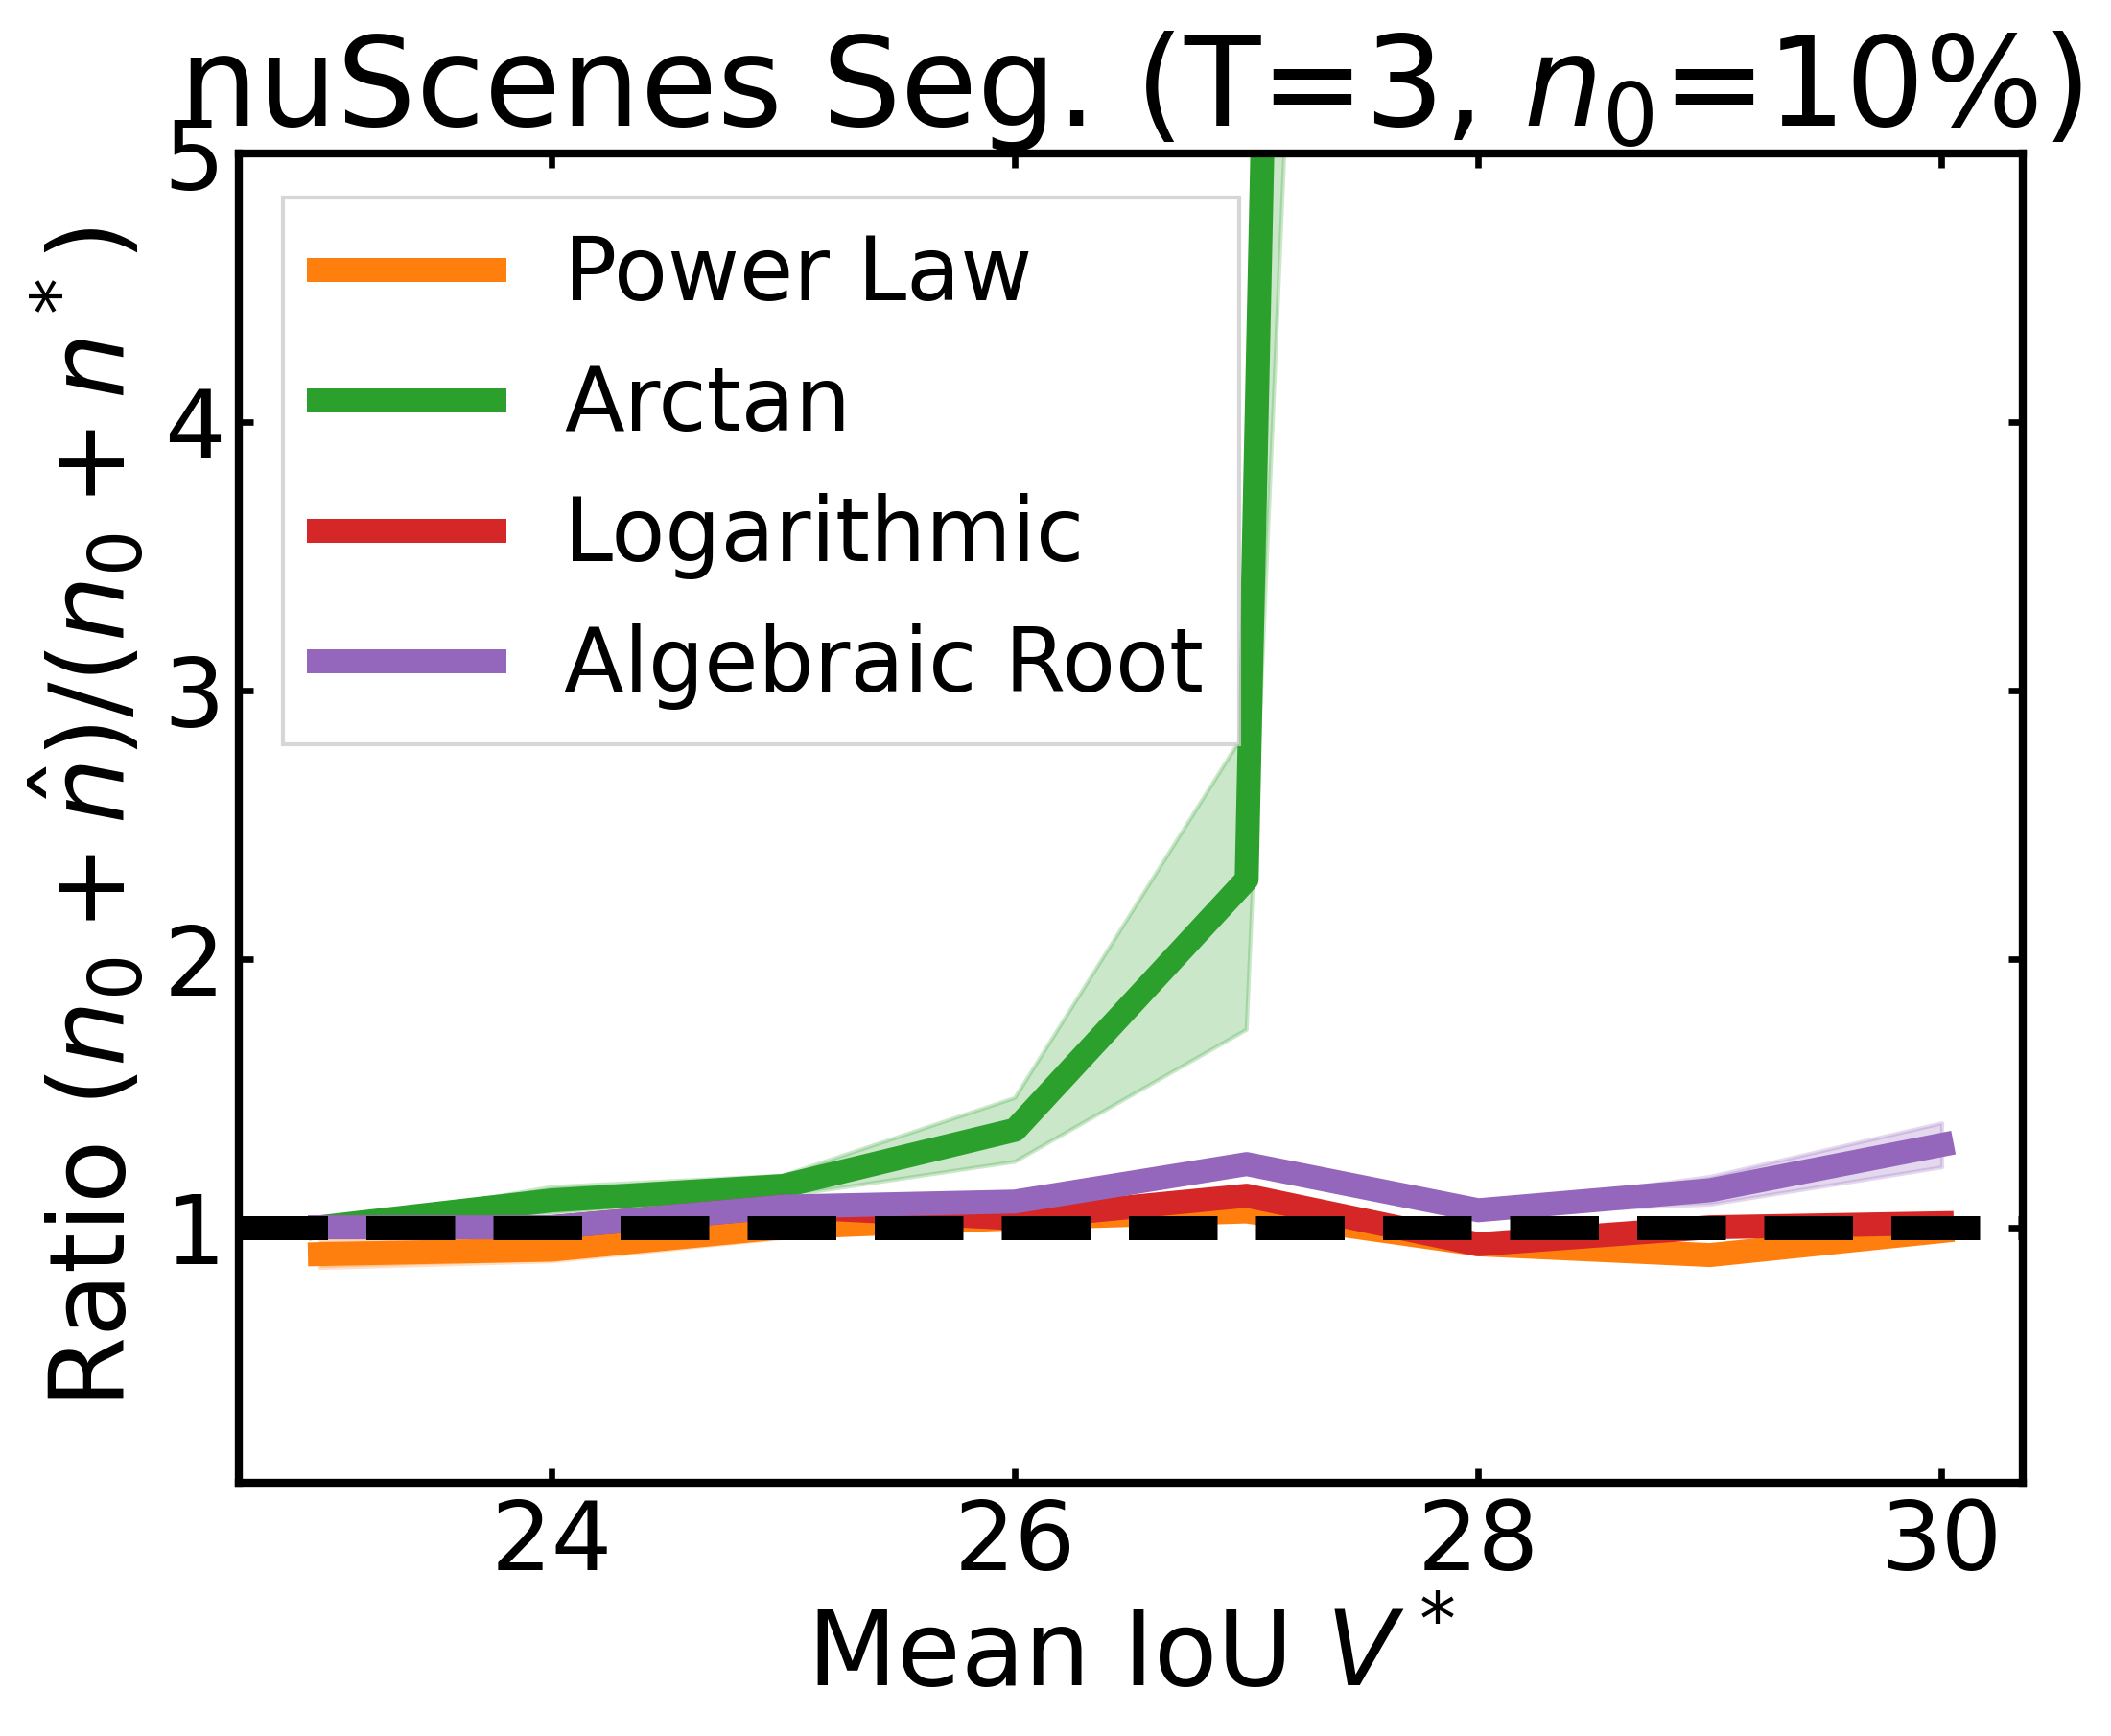
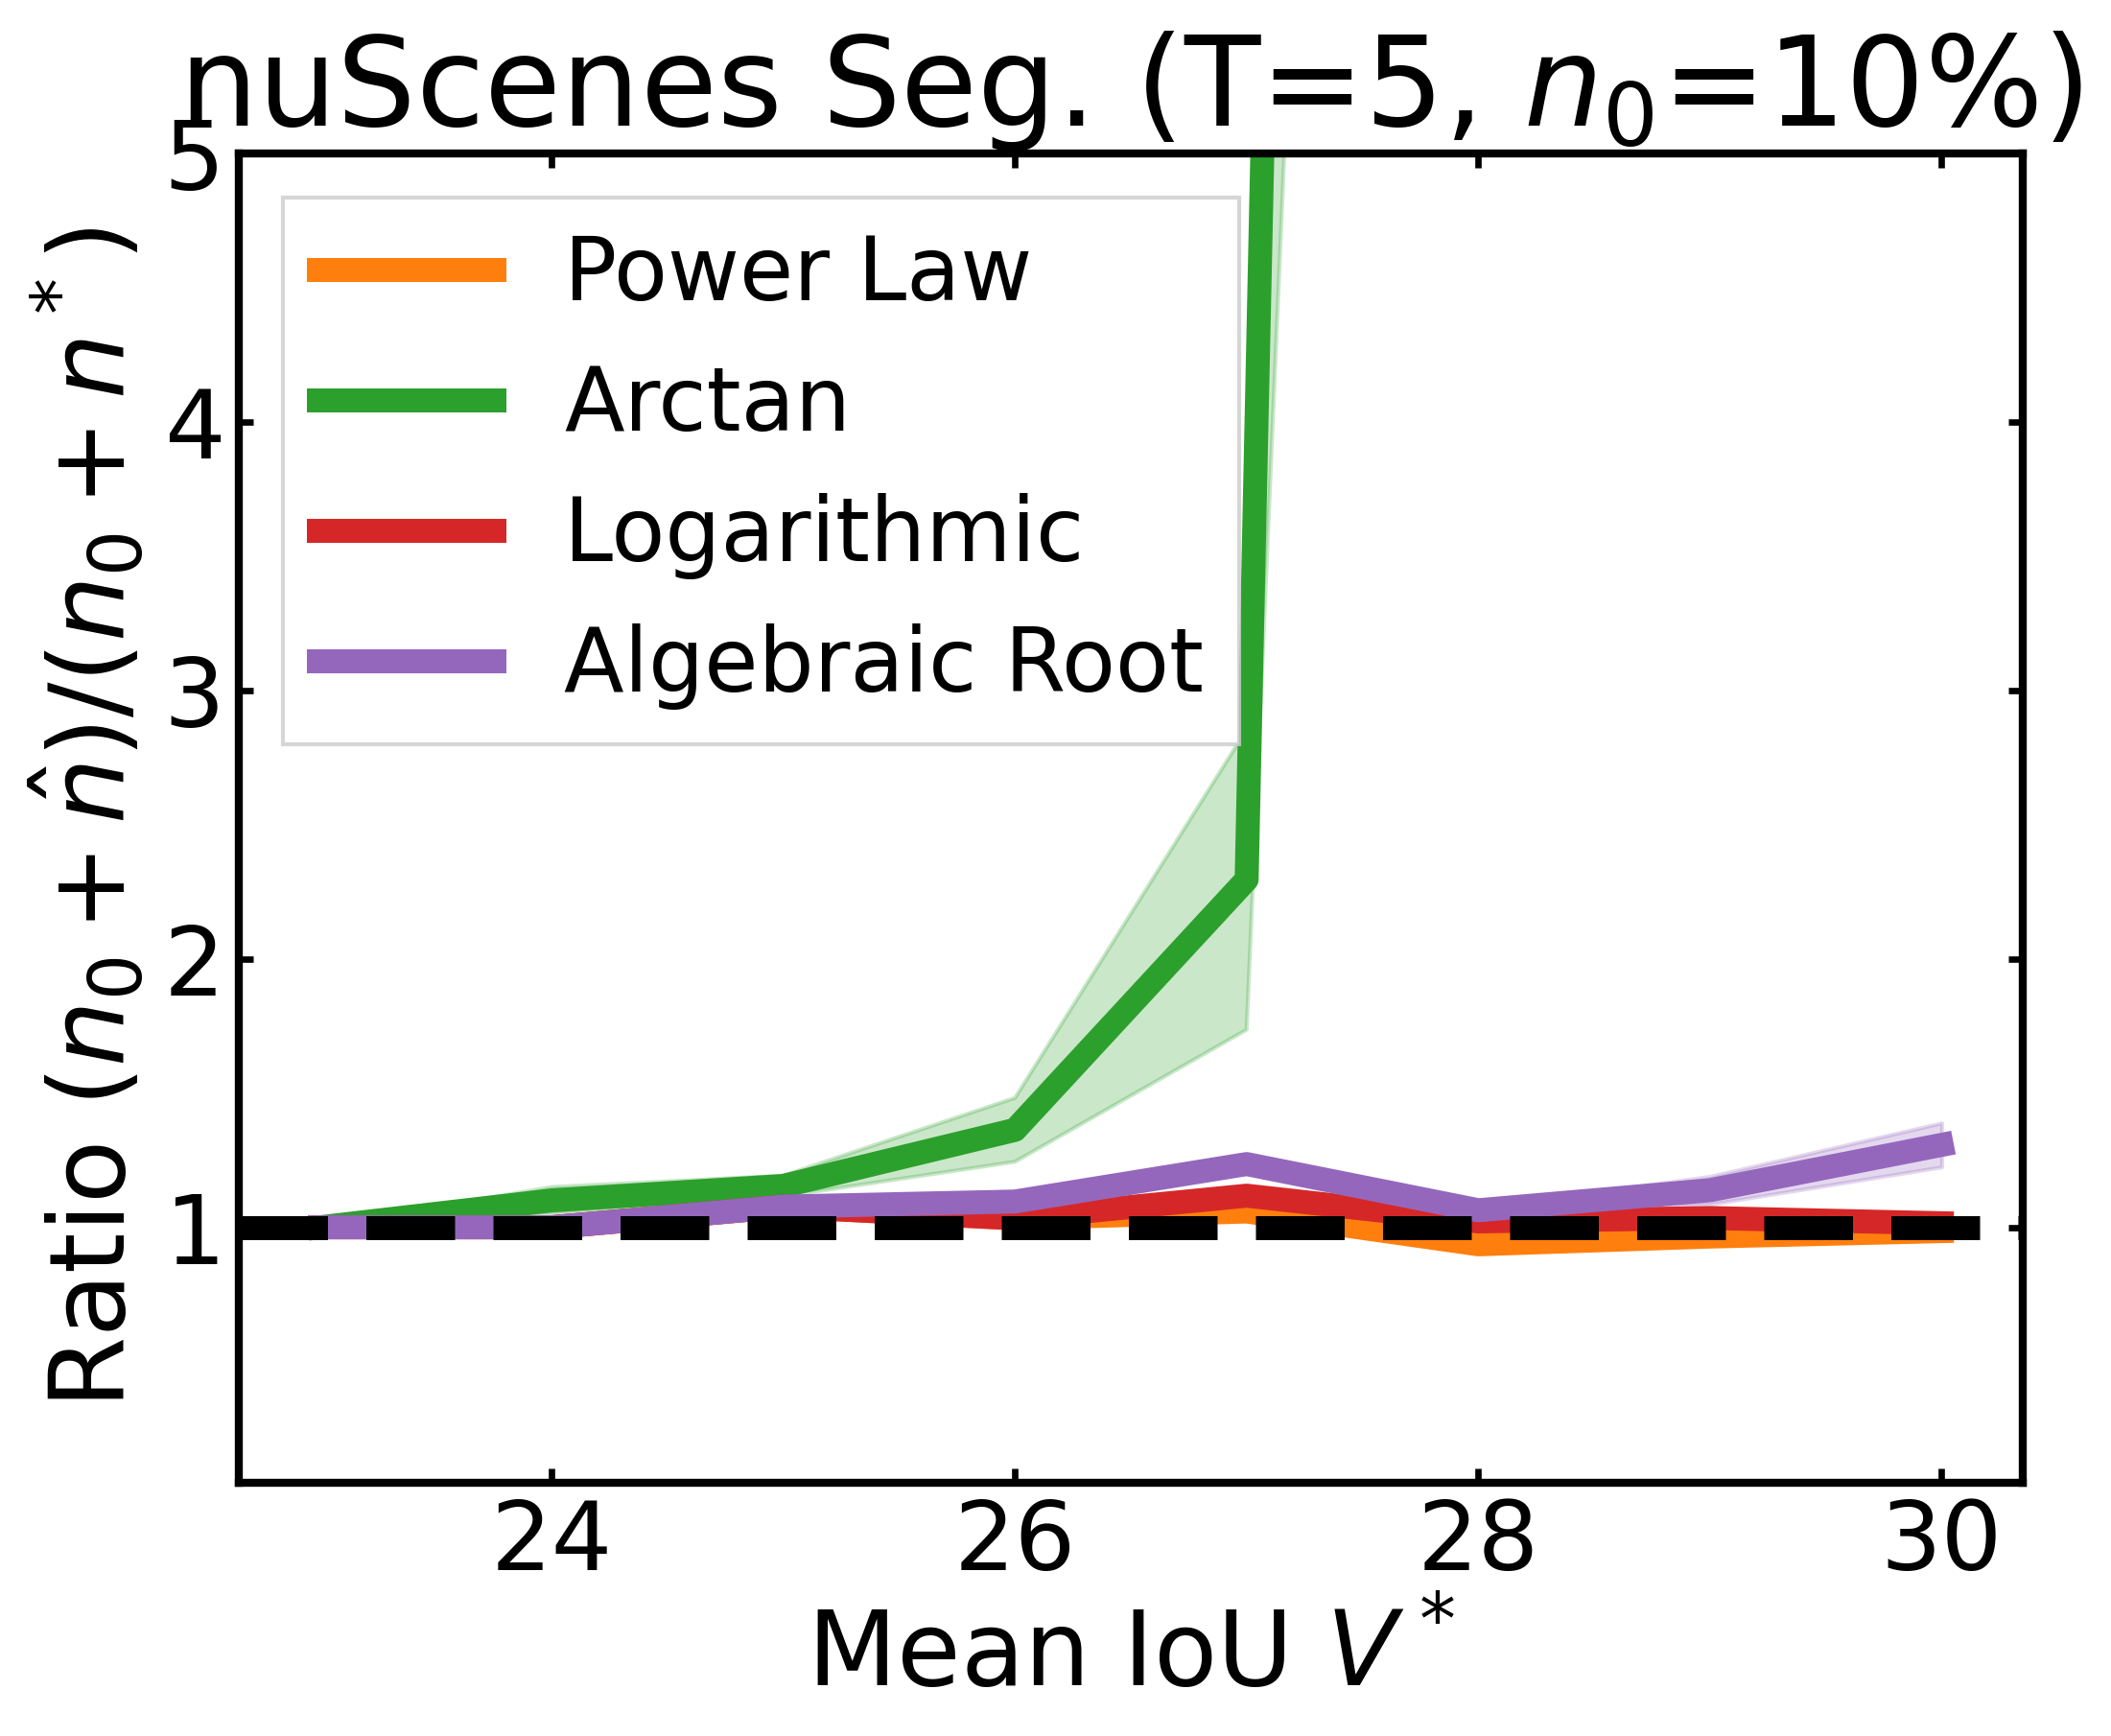
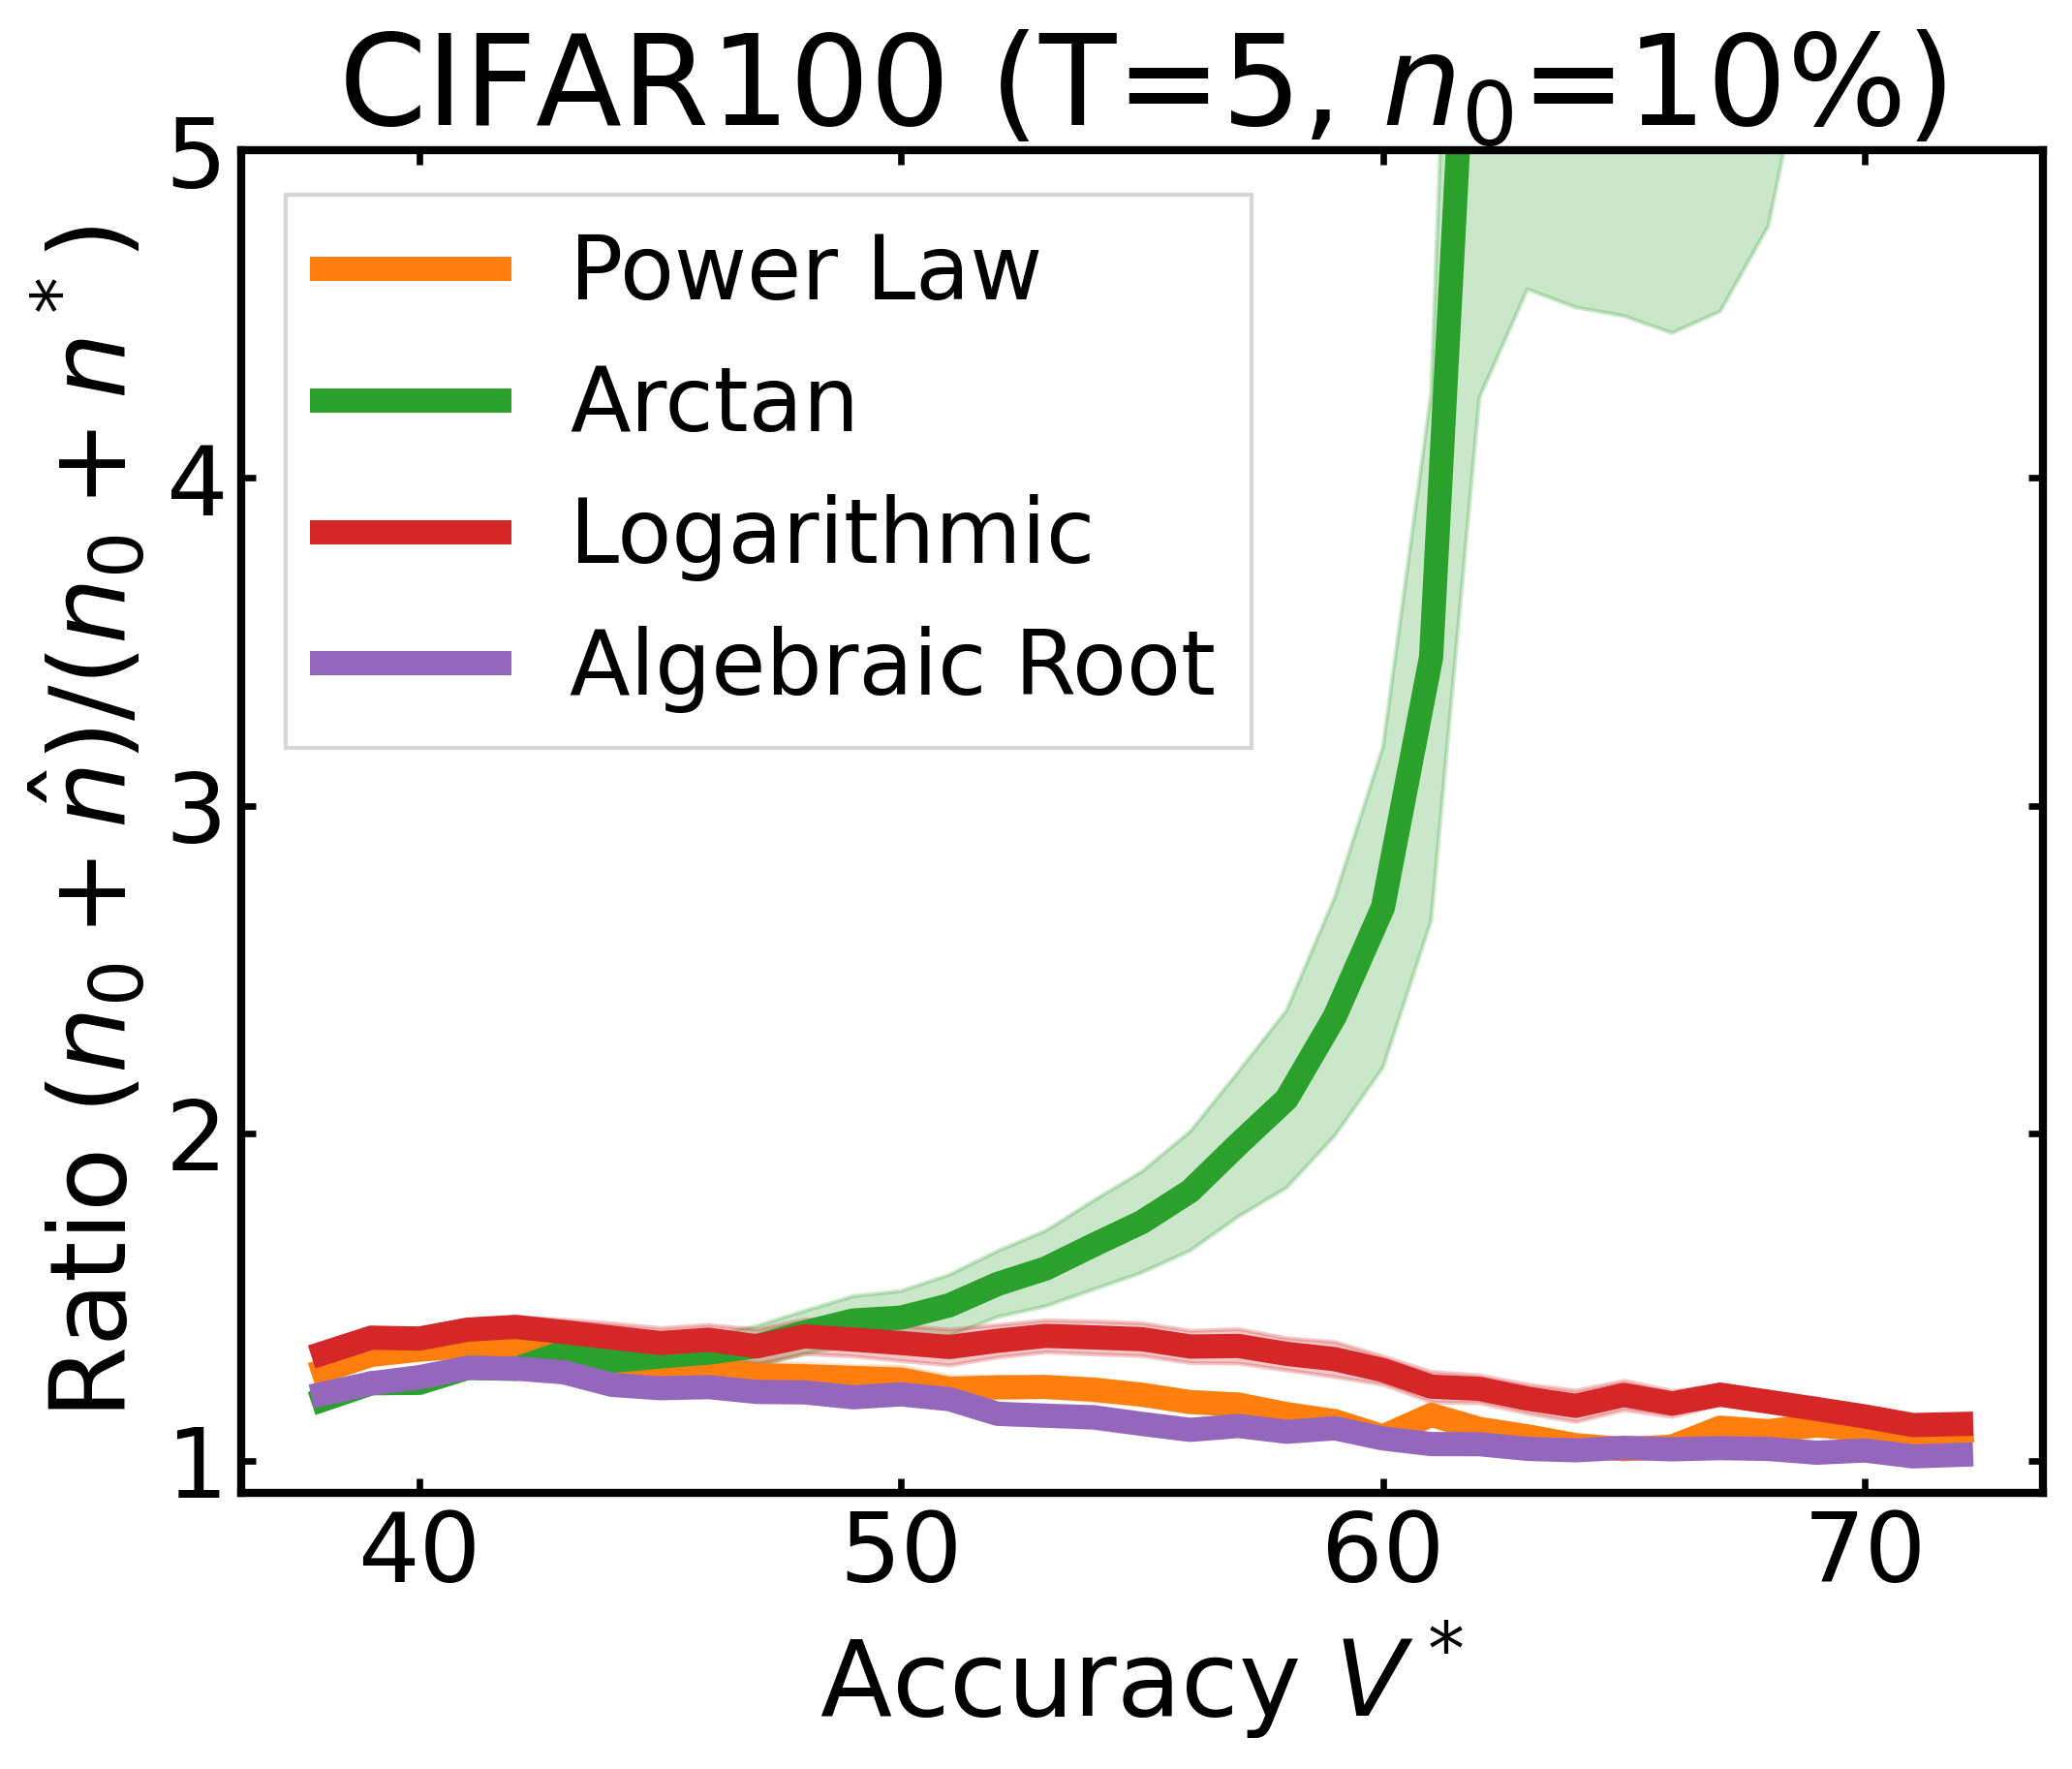
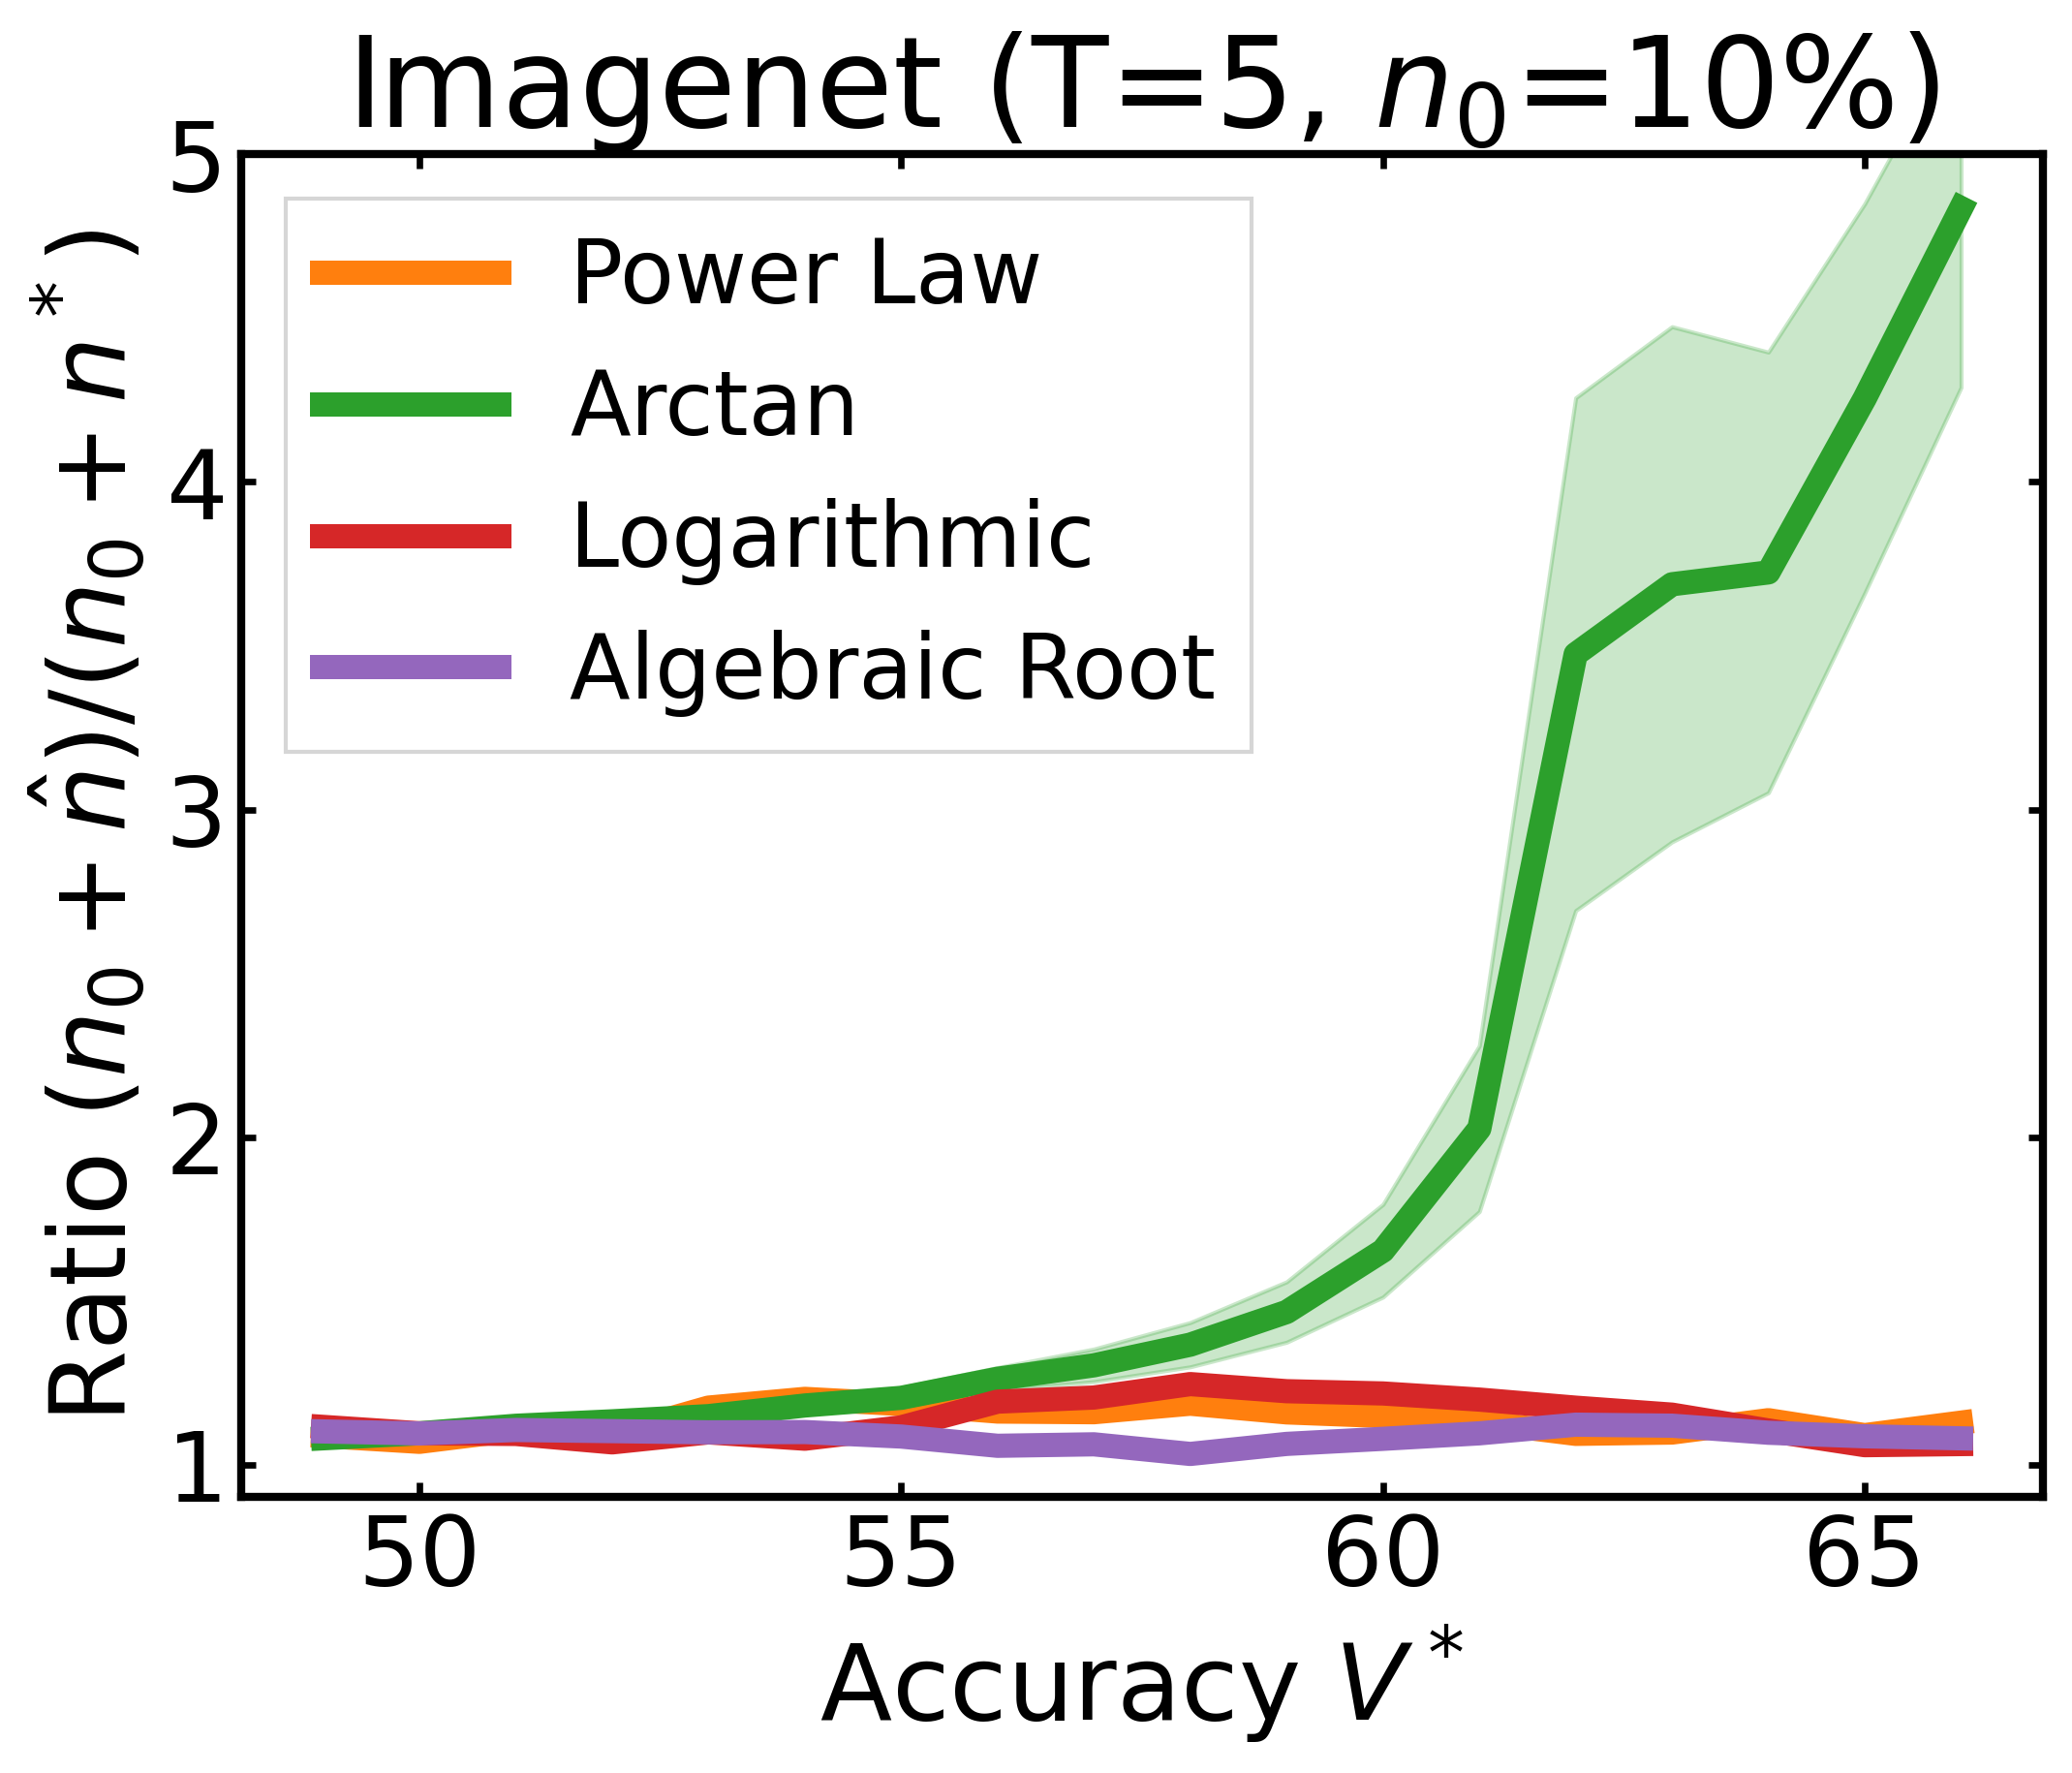
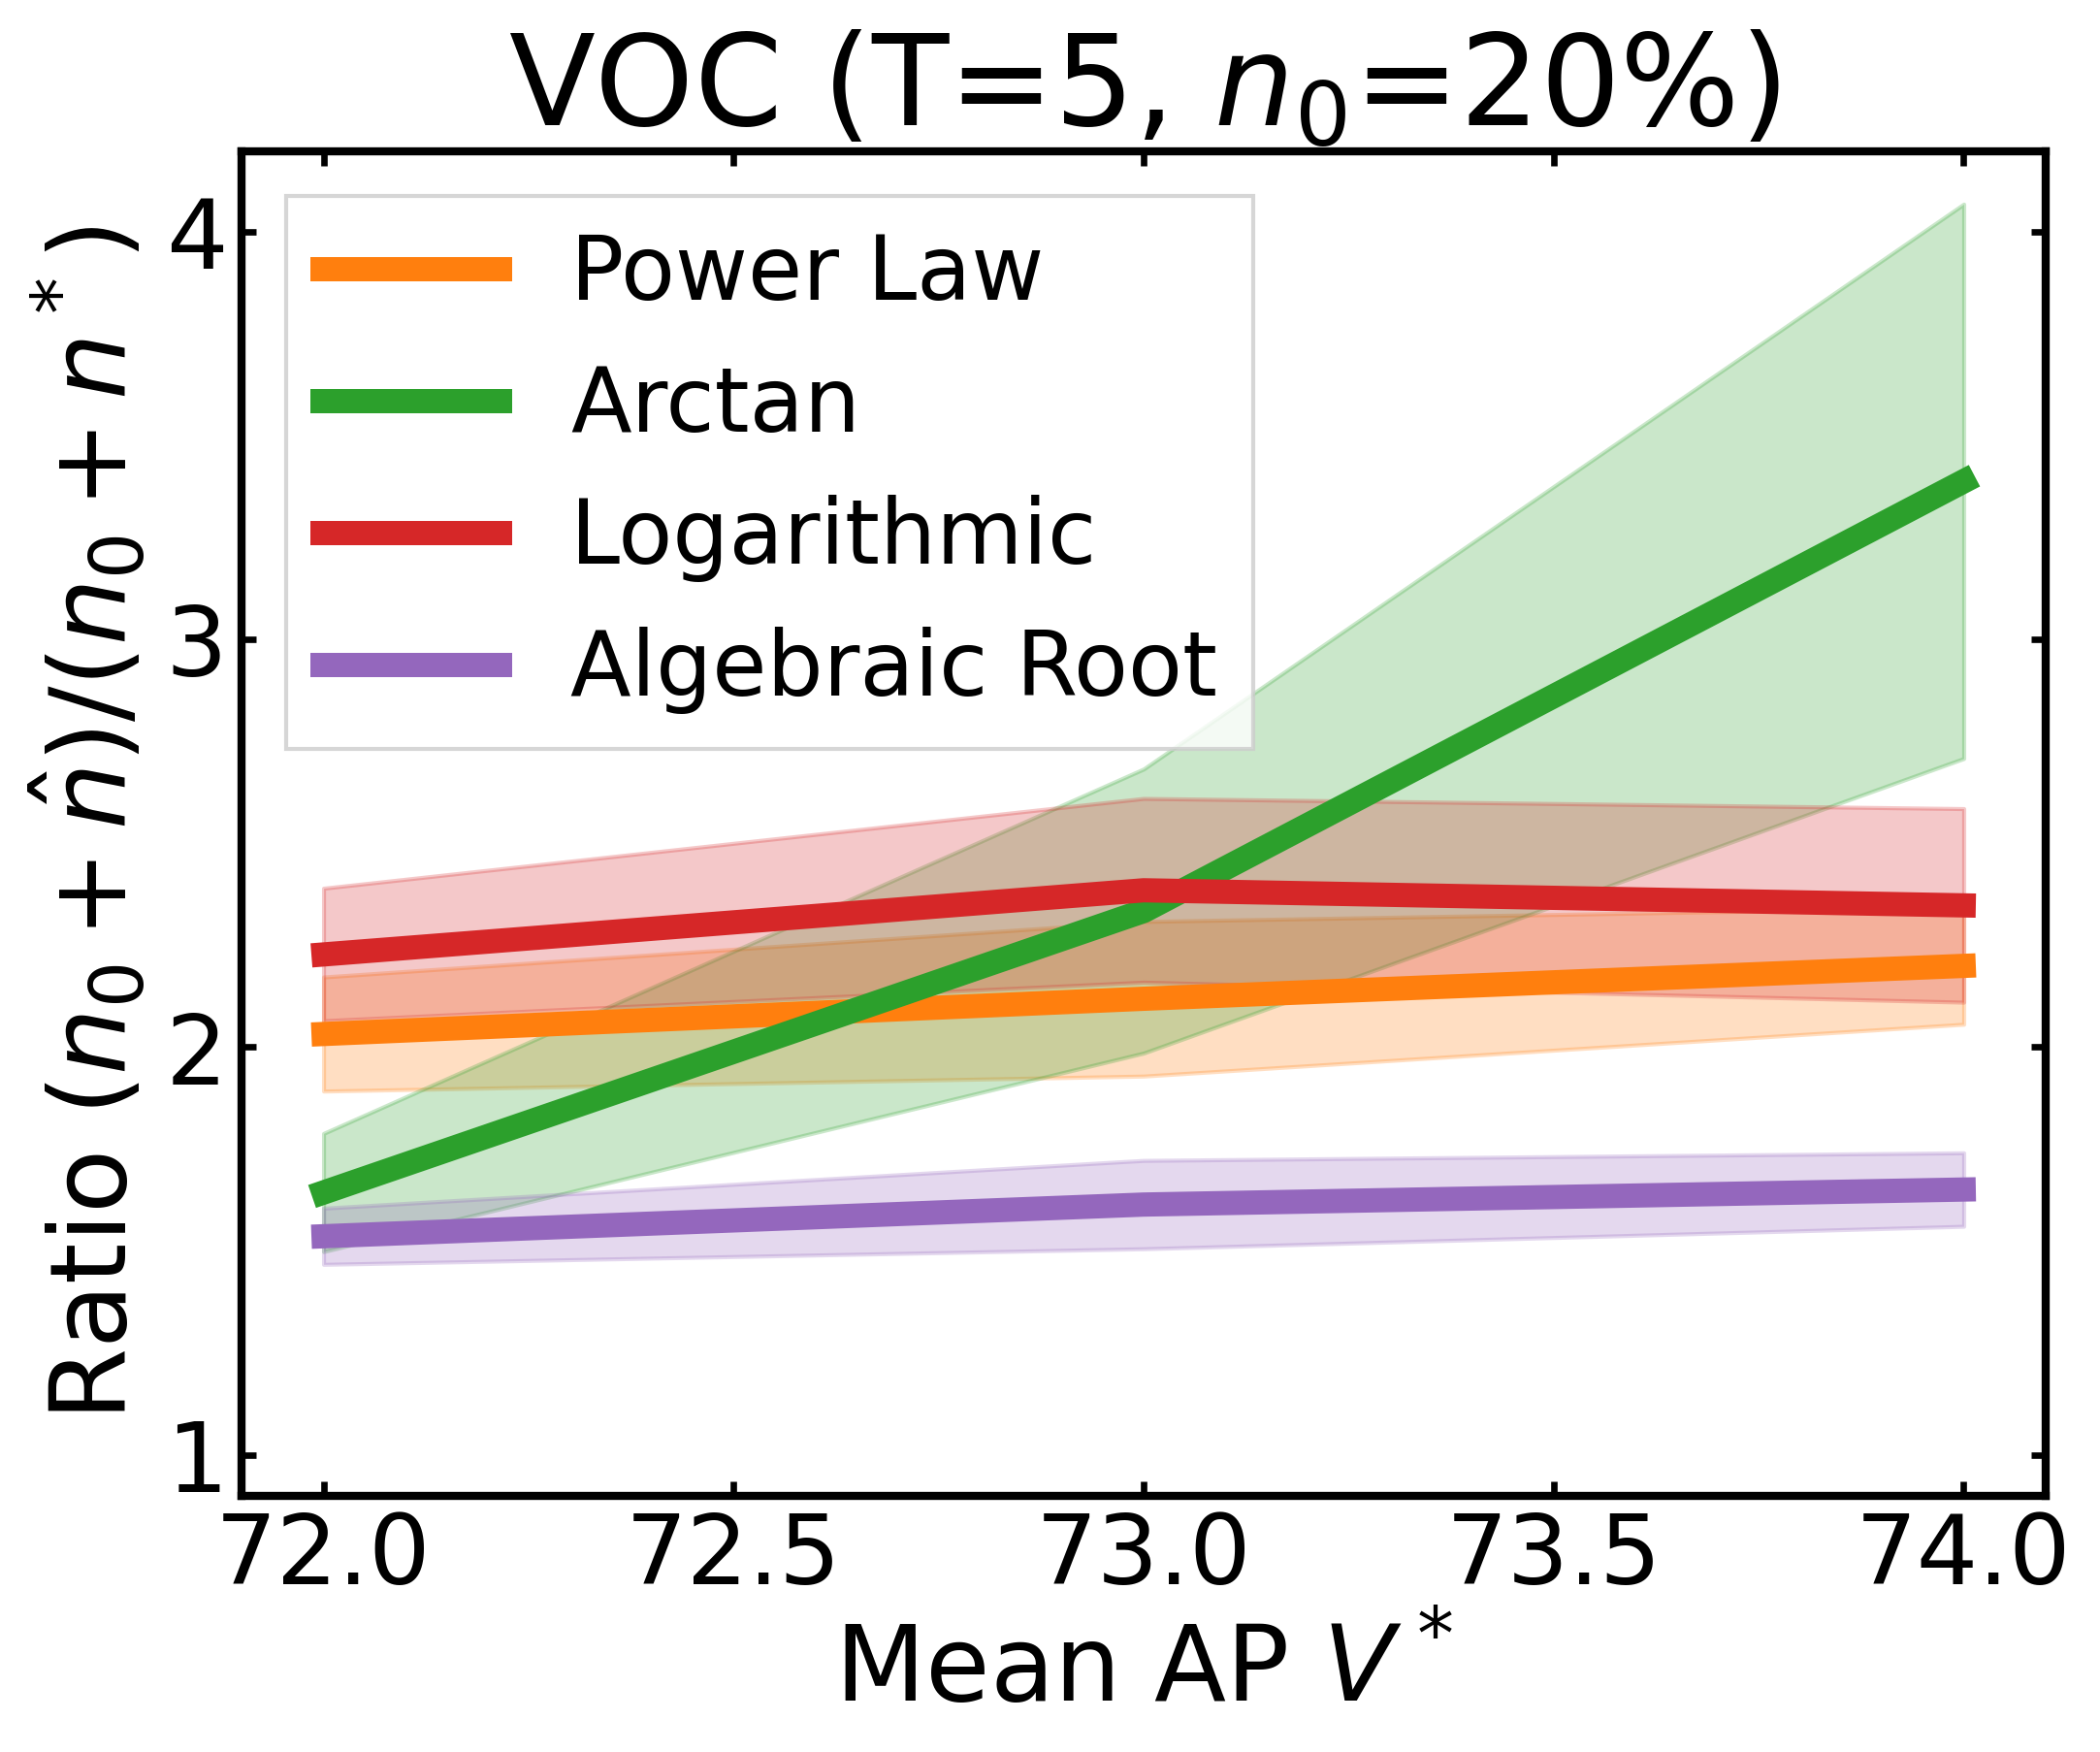
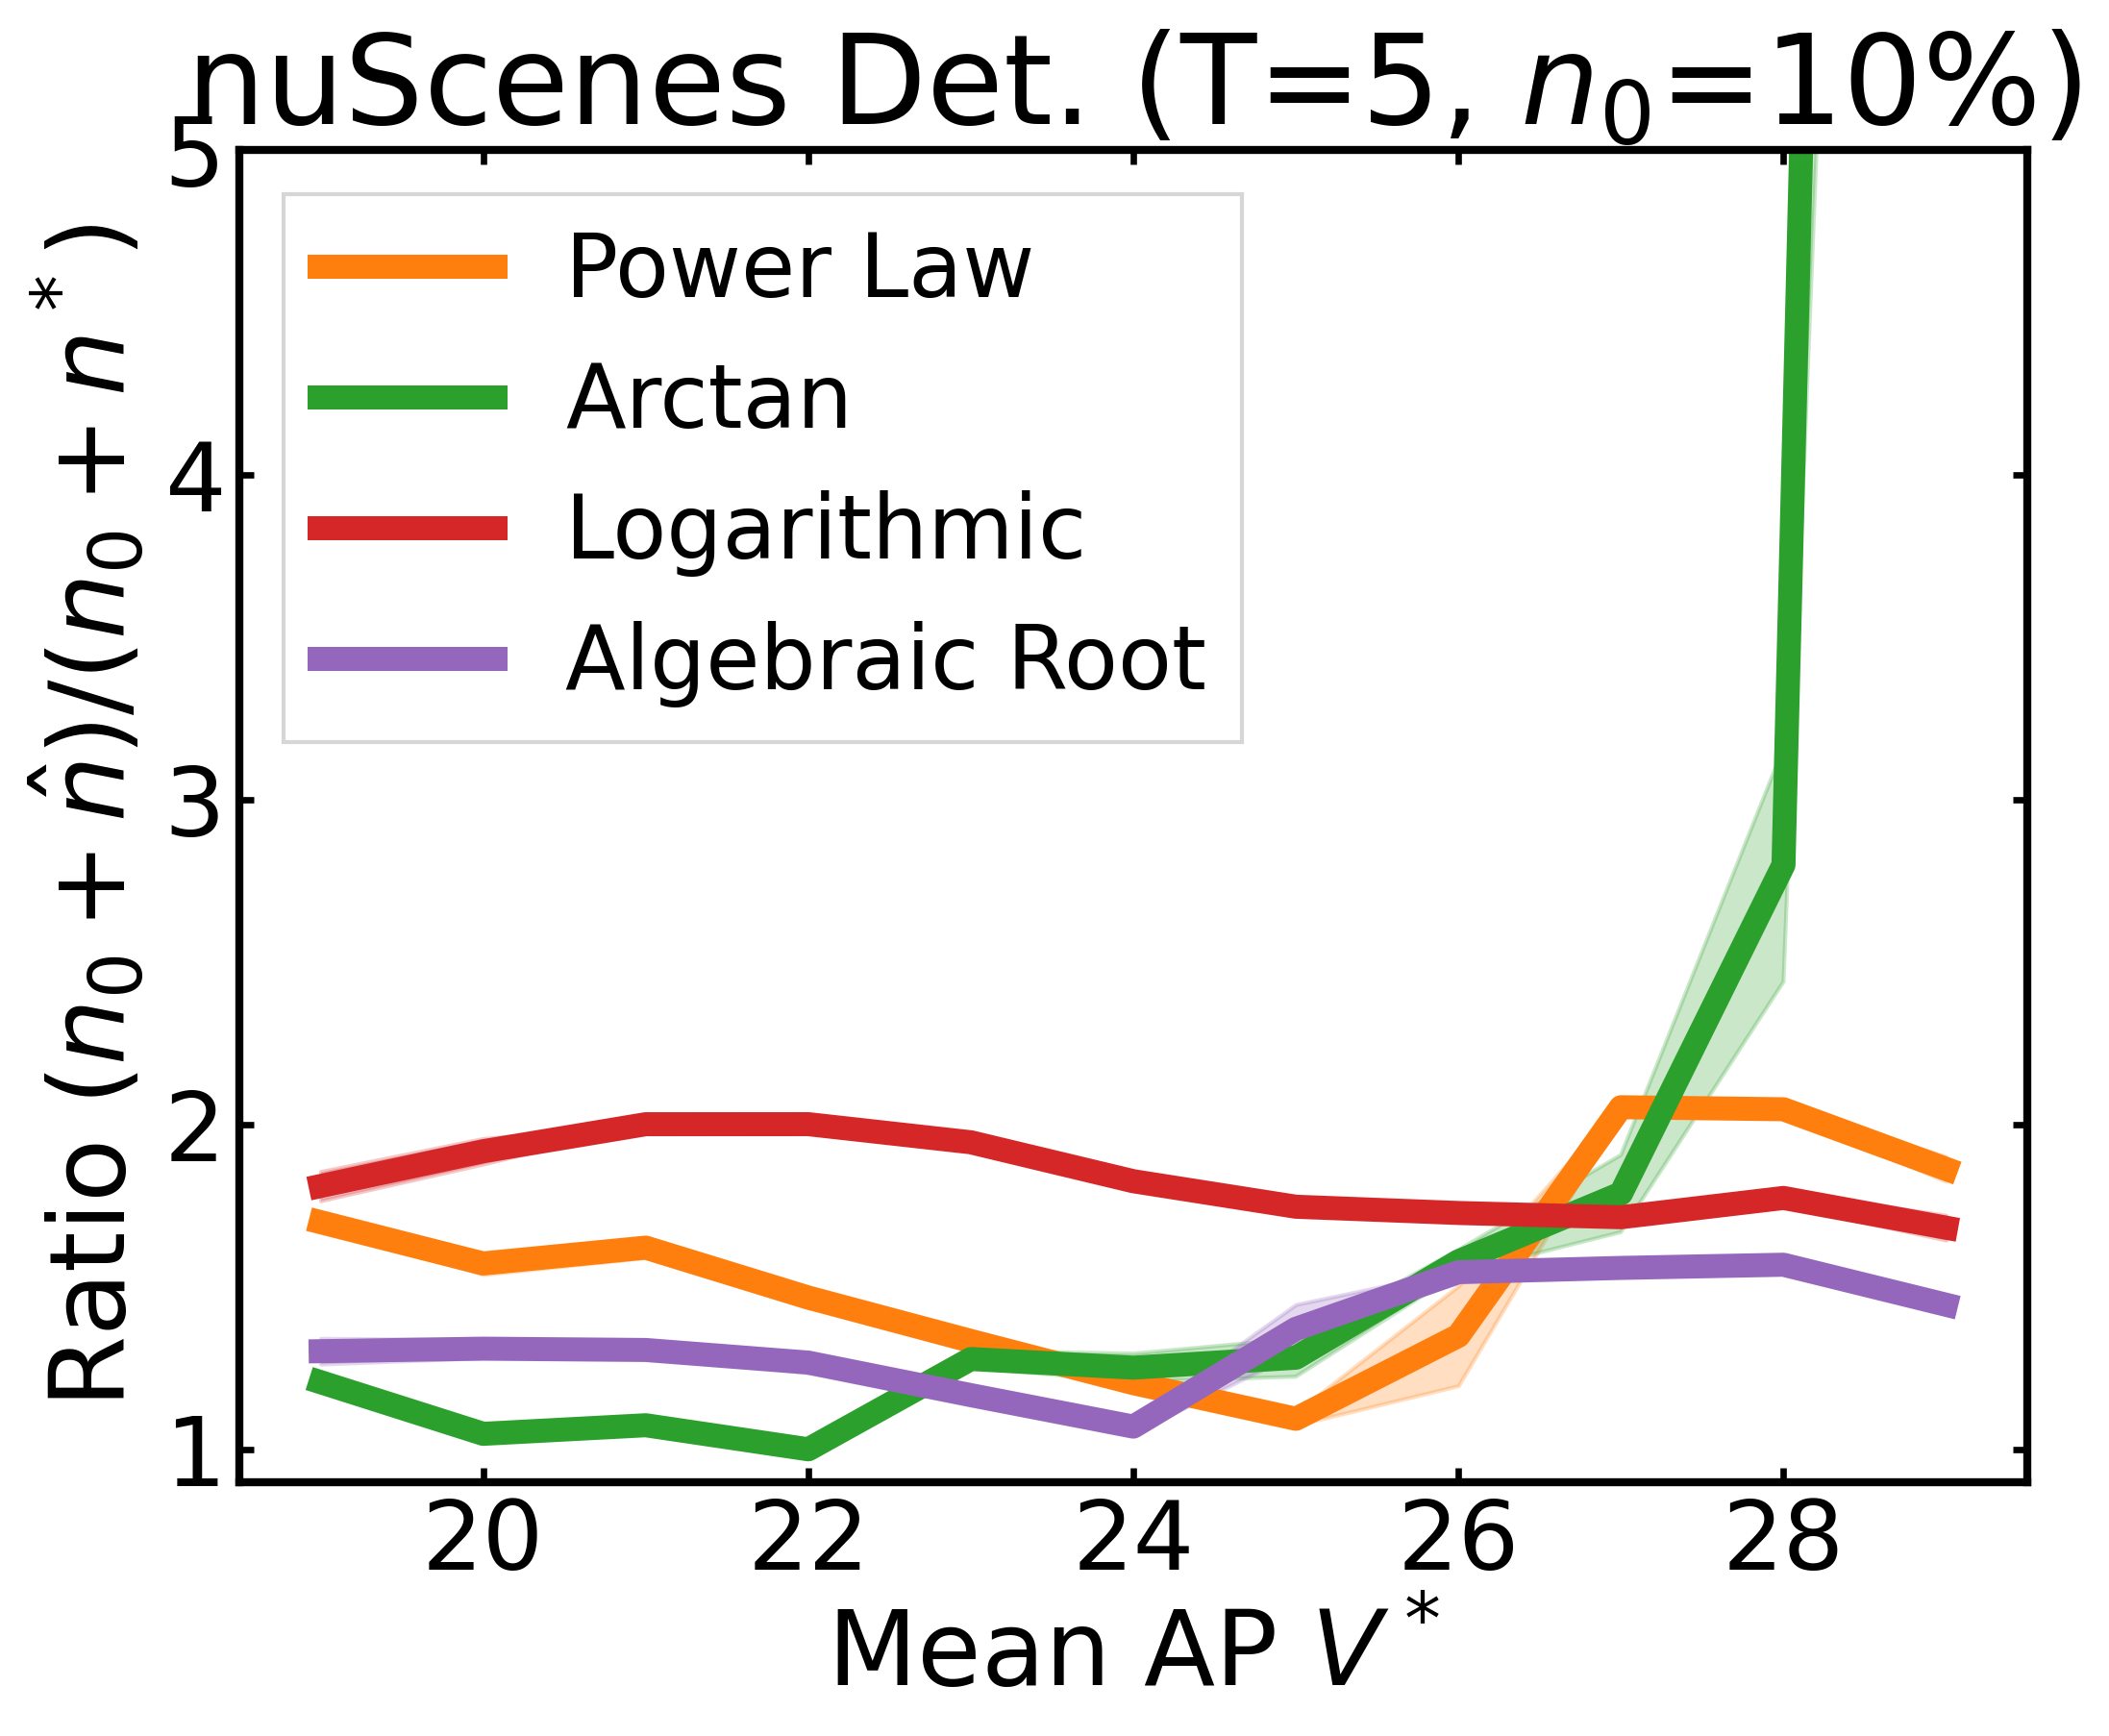
We plot the ratio of the total amount of data collected over the minimum amount of data needed (y-axis) for different target V* values (x-axis) in simulations initializing with n0 = 10% of the data set (n0 = 20% for VOC). We explore seven data sets covering classification, detection, and segmentation. For each data set, we show simulations for T = 1, 3, 5 rounds. The dashed black line corresponds to a ratio of 1, i.e., collecting exactly the minimum amount of data needed. We observe that the Arctan function consistently leads to over-collecting data (i.e., ratios greater than 1), whereas the other functions consistently lead to under-collecting data (i.e., ratios less than 1).

If our target is V*, let us instead collect data to meet V*+τ, where τ is a correction factor to promote over-collection. We can learn a good value for this correction factor by simulating on previous tasks, e.g., use our experience on CIFAR10 to learn a factor for ImageNet.
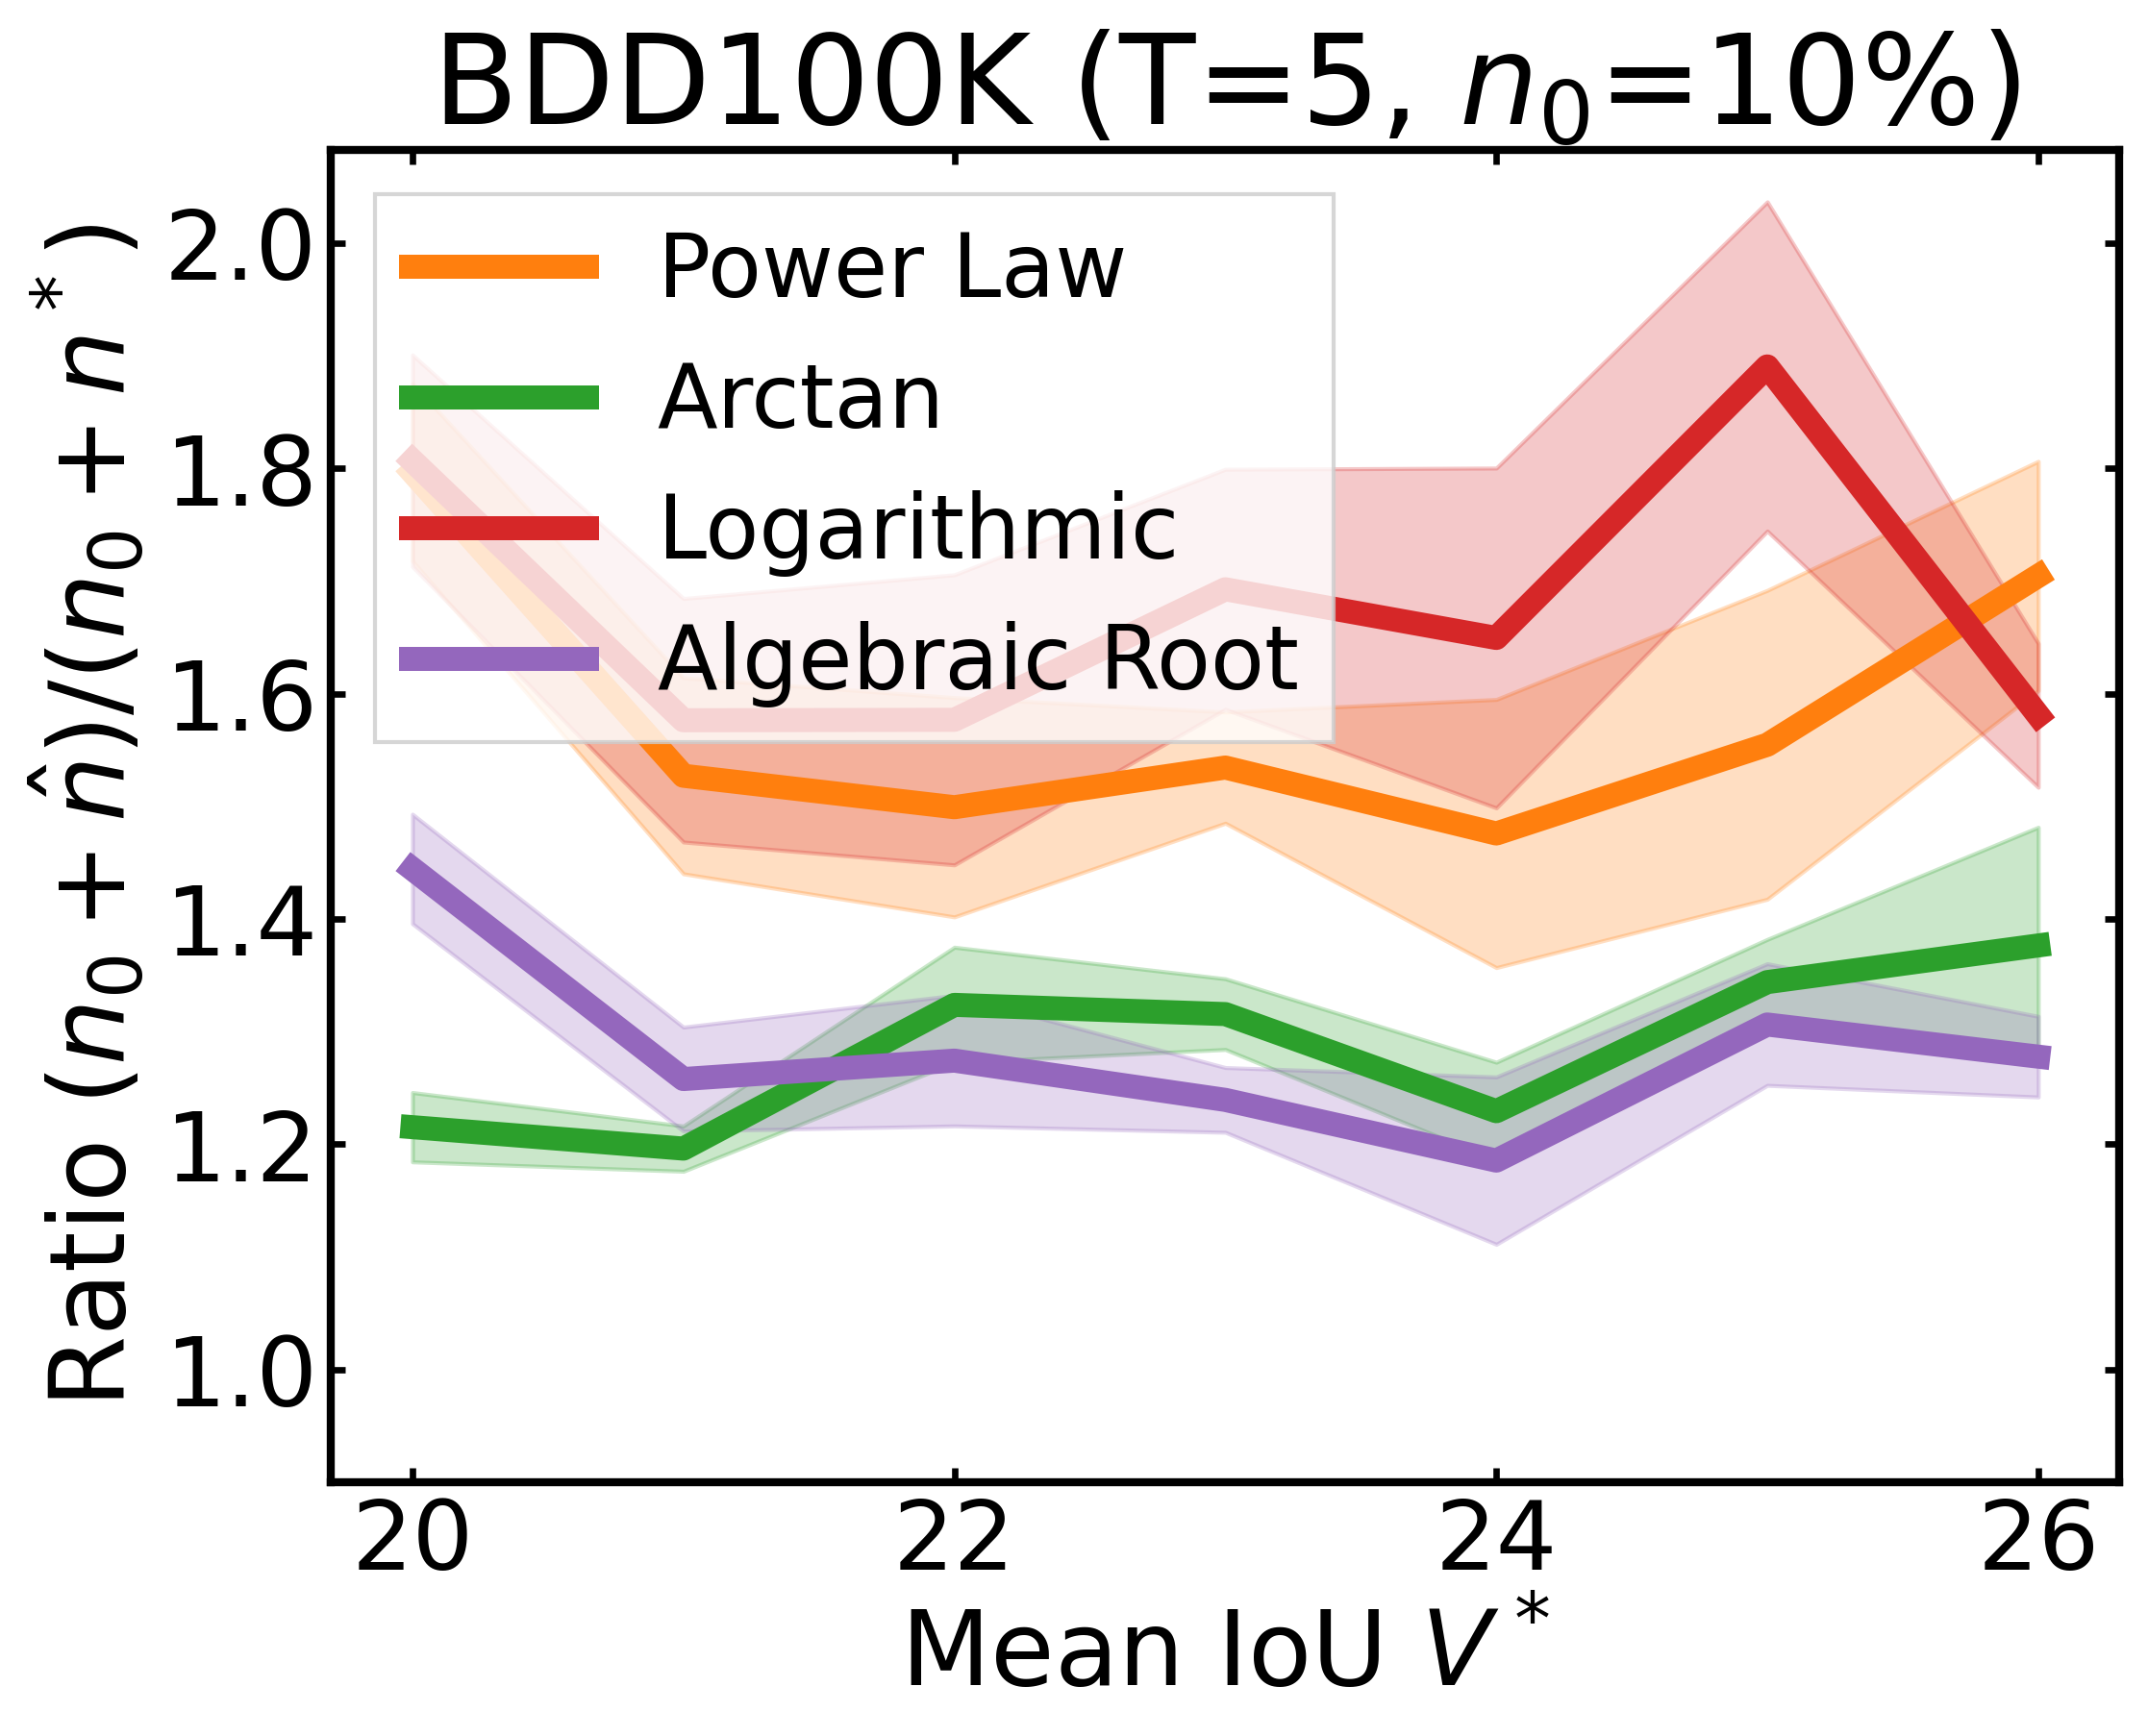
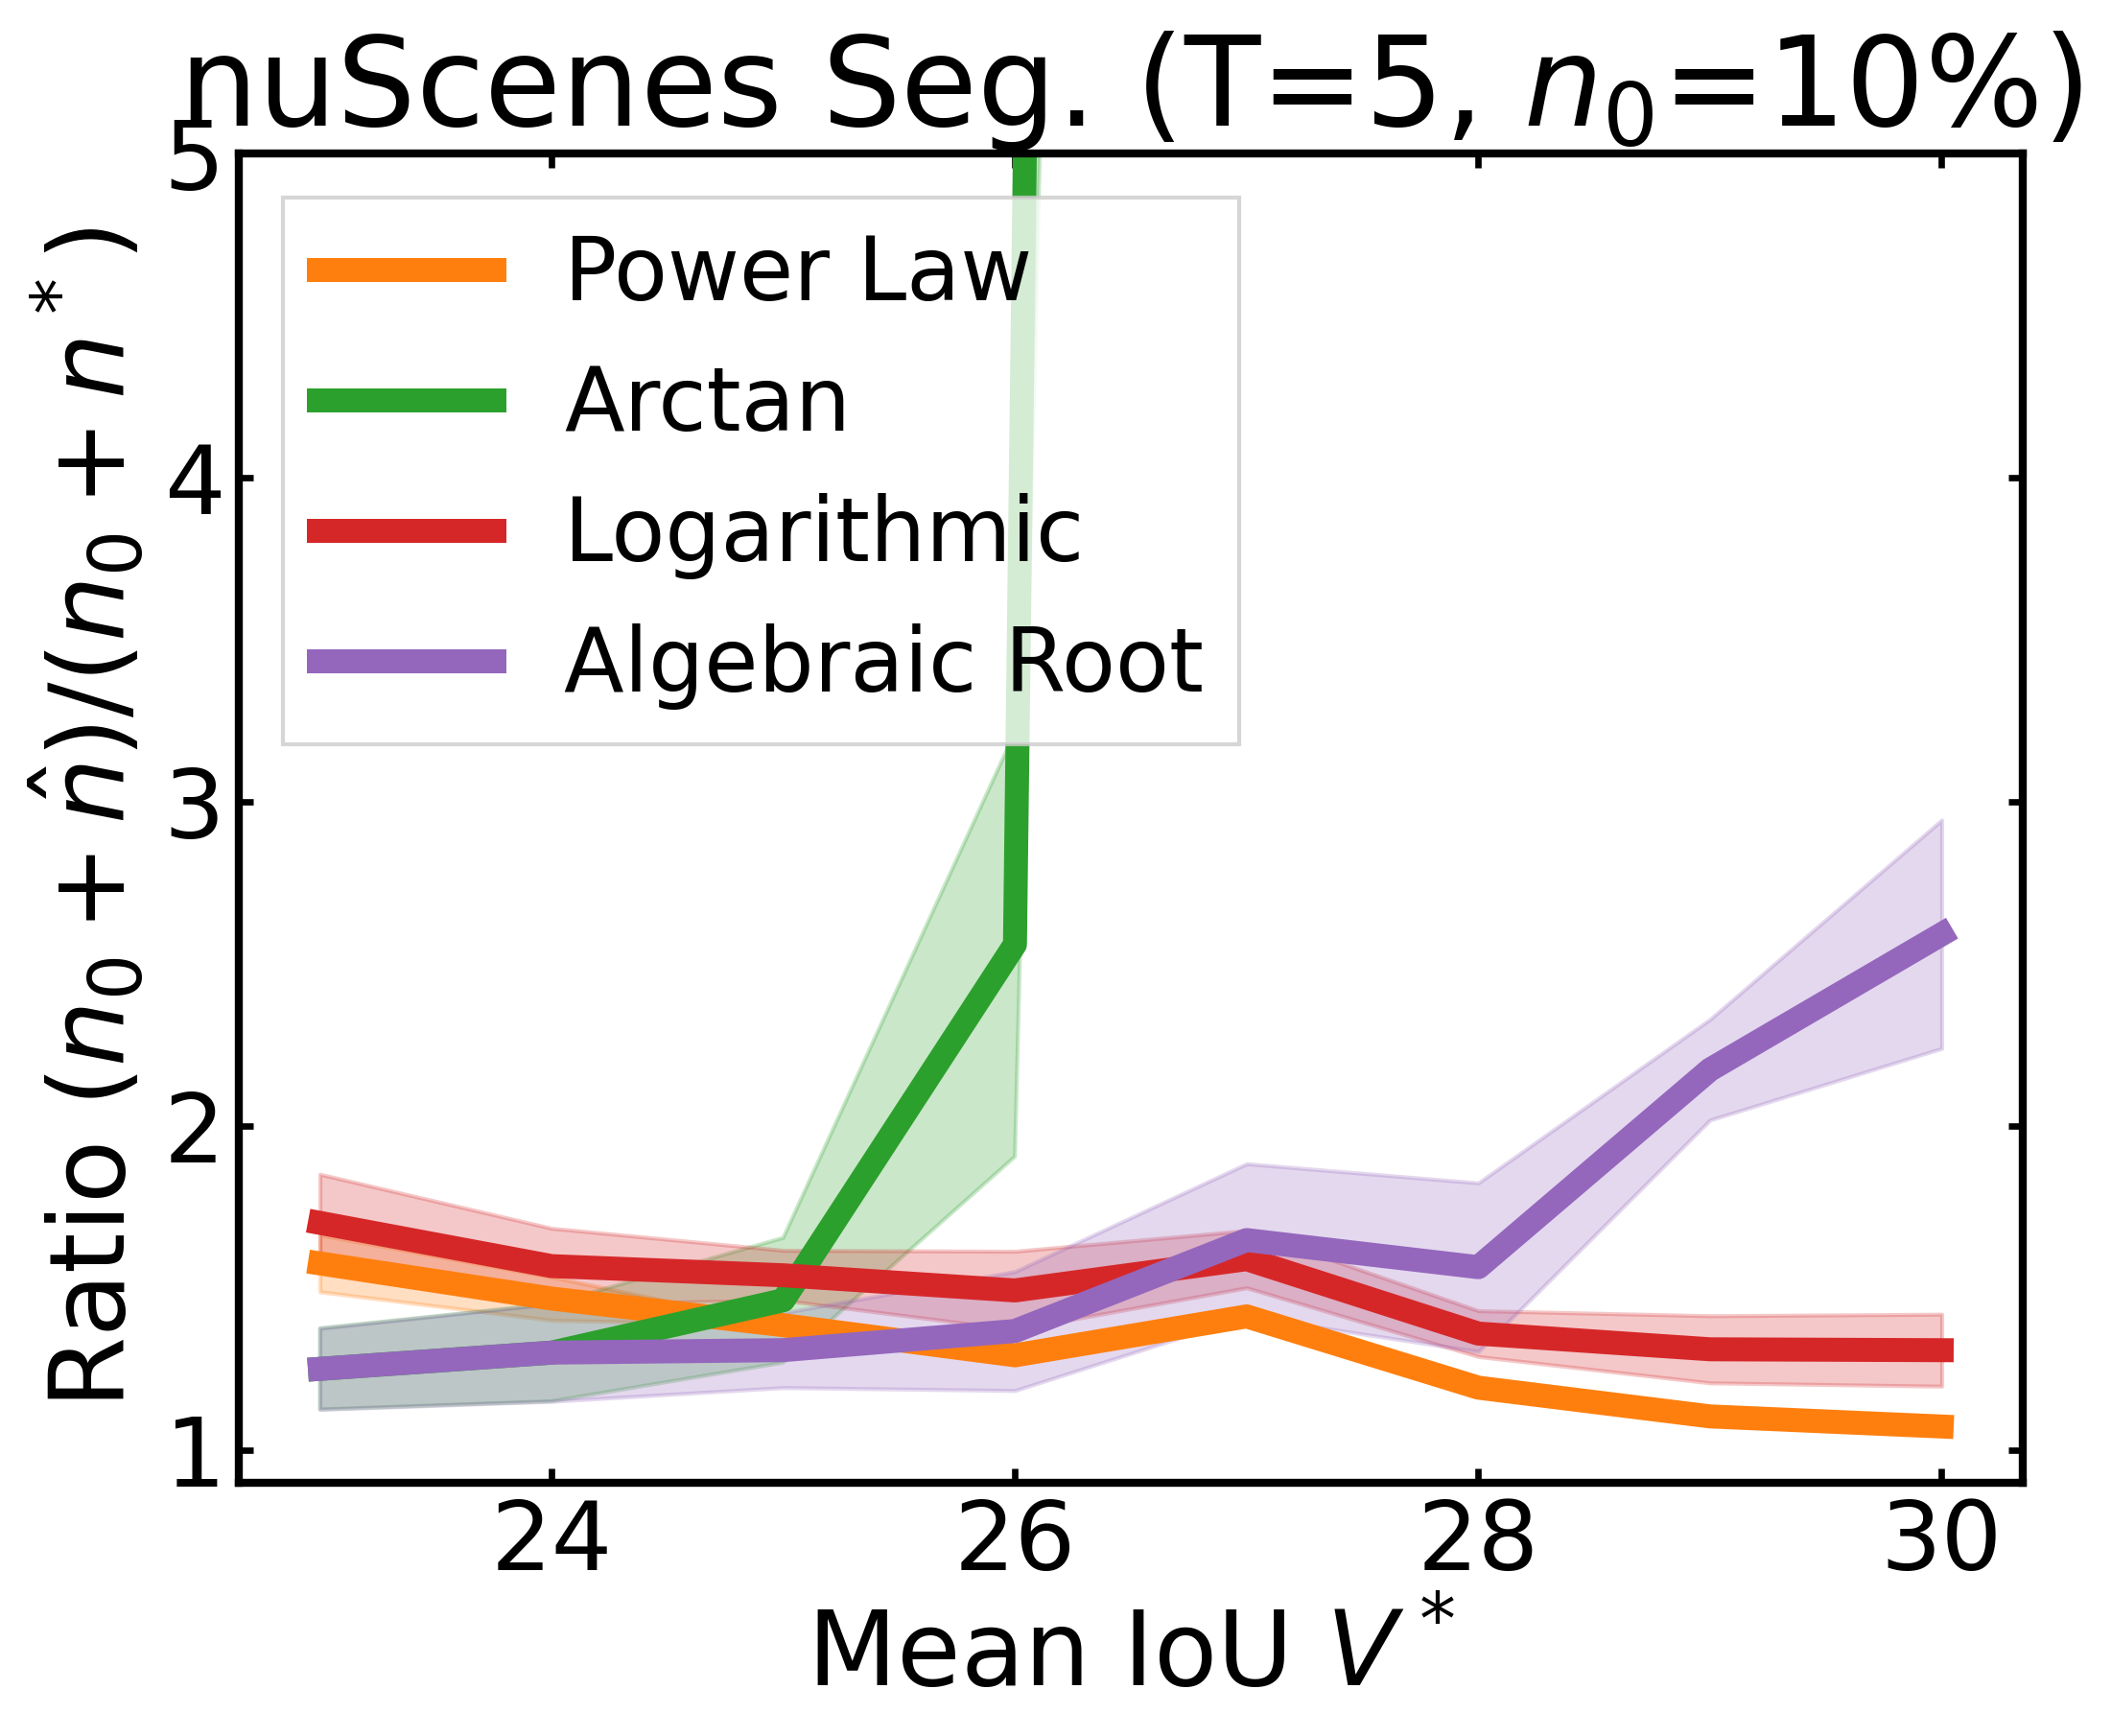
After incorporating a correction factor learned from CIFAR10, we plot the ratio of the total amount of data collected over the minimum amount of data needed (y-axis) for different target V* values (x-axis) in simulations. Using this correction factor allows the under-collecting regression functions (i.e., Power Law, Logarithmic, Algebraic Root) to now collect slightly more than the minimum amount of data required (i.e., achieve ratios less than 2).
            @InProceedings{Mahmood_2022_CVPR,
                author    = {Mahmood, Rafid and Lucas, James and Acuna, David and Li, Daiqing
                                and Philion, Jonah and Alvarez, Jose M. and Yu, Zhiding and Fidler, Sanja
                                and Law, Marc T.},
                title     = {How Much More Data Do I Need? Estimating Requirements for Downstream Tasks},
                booktitle = {Proceedings of the IEEE/CVF Conference on Computer Vision and Pattern
                                Recognition (CVPR)},
                month     = {June},
                year      = {2022},
                pages     = {275-284}}