
Leaderboards#
Evaluation tool: aggregate model comparison, recomputed live on whatever slice your current search defines.
Wheel provides project-specific leaderboards for evaluating registered models on arbitrary search slices. Each leaderboard is tied to a particular evaluation setup, with its own models, metrics, and prediction type. This allows the same slice-based workflow to be reused across different projects, such as driving models, VLMs, or generative systems.
Reach for it when you want to rank models against each other, on the full dataset or on a curated slice, and find where a particular model degrades. Any row expands to the per-clip scores behind it, so the hardest clips for a model can be pulled straight into further annotation or classifier work.
Reach for something else when you already know which clips are interesting and want to see what each model actually predicted on them; that is Model Predictions.
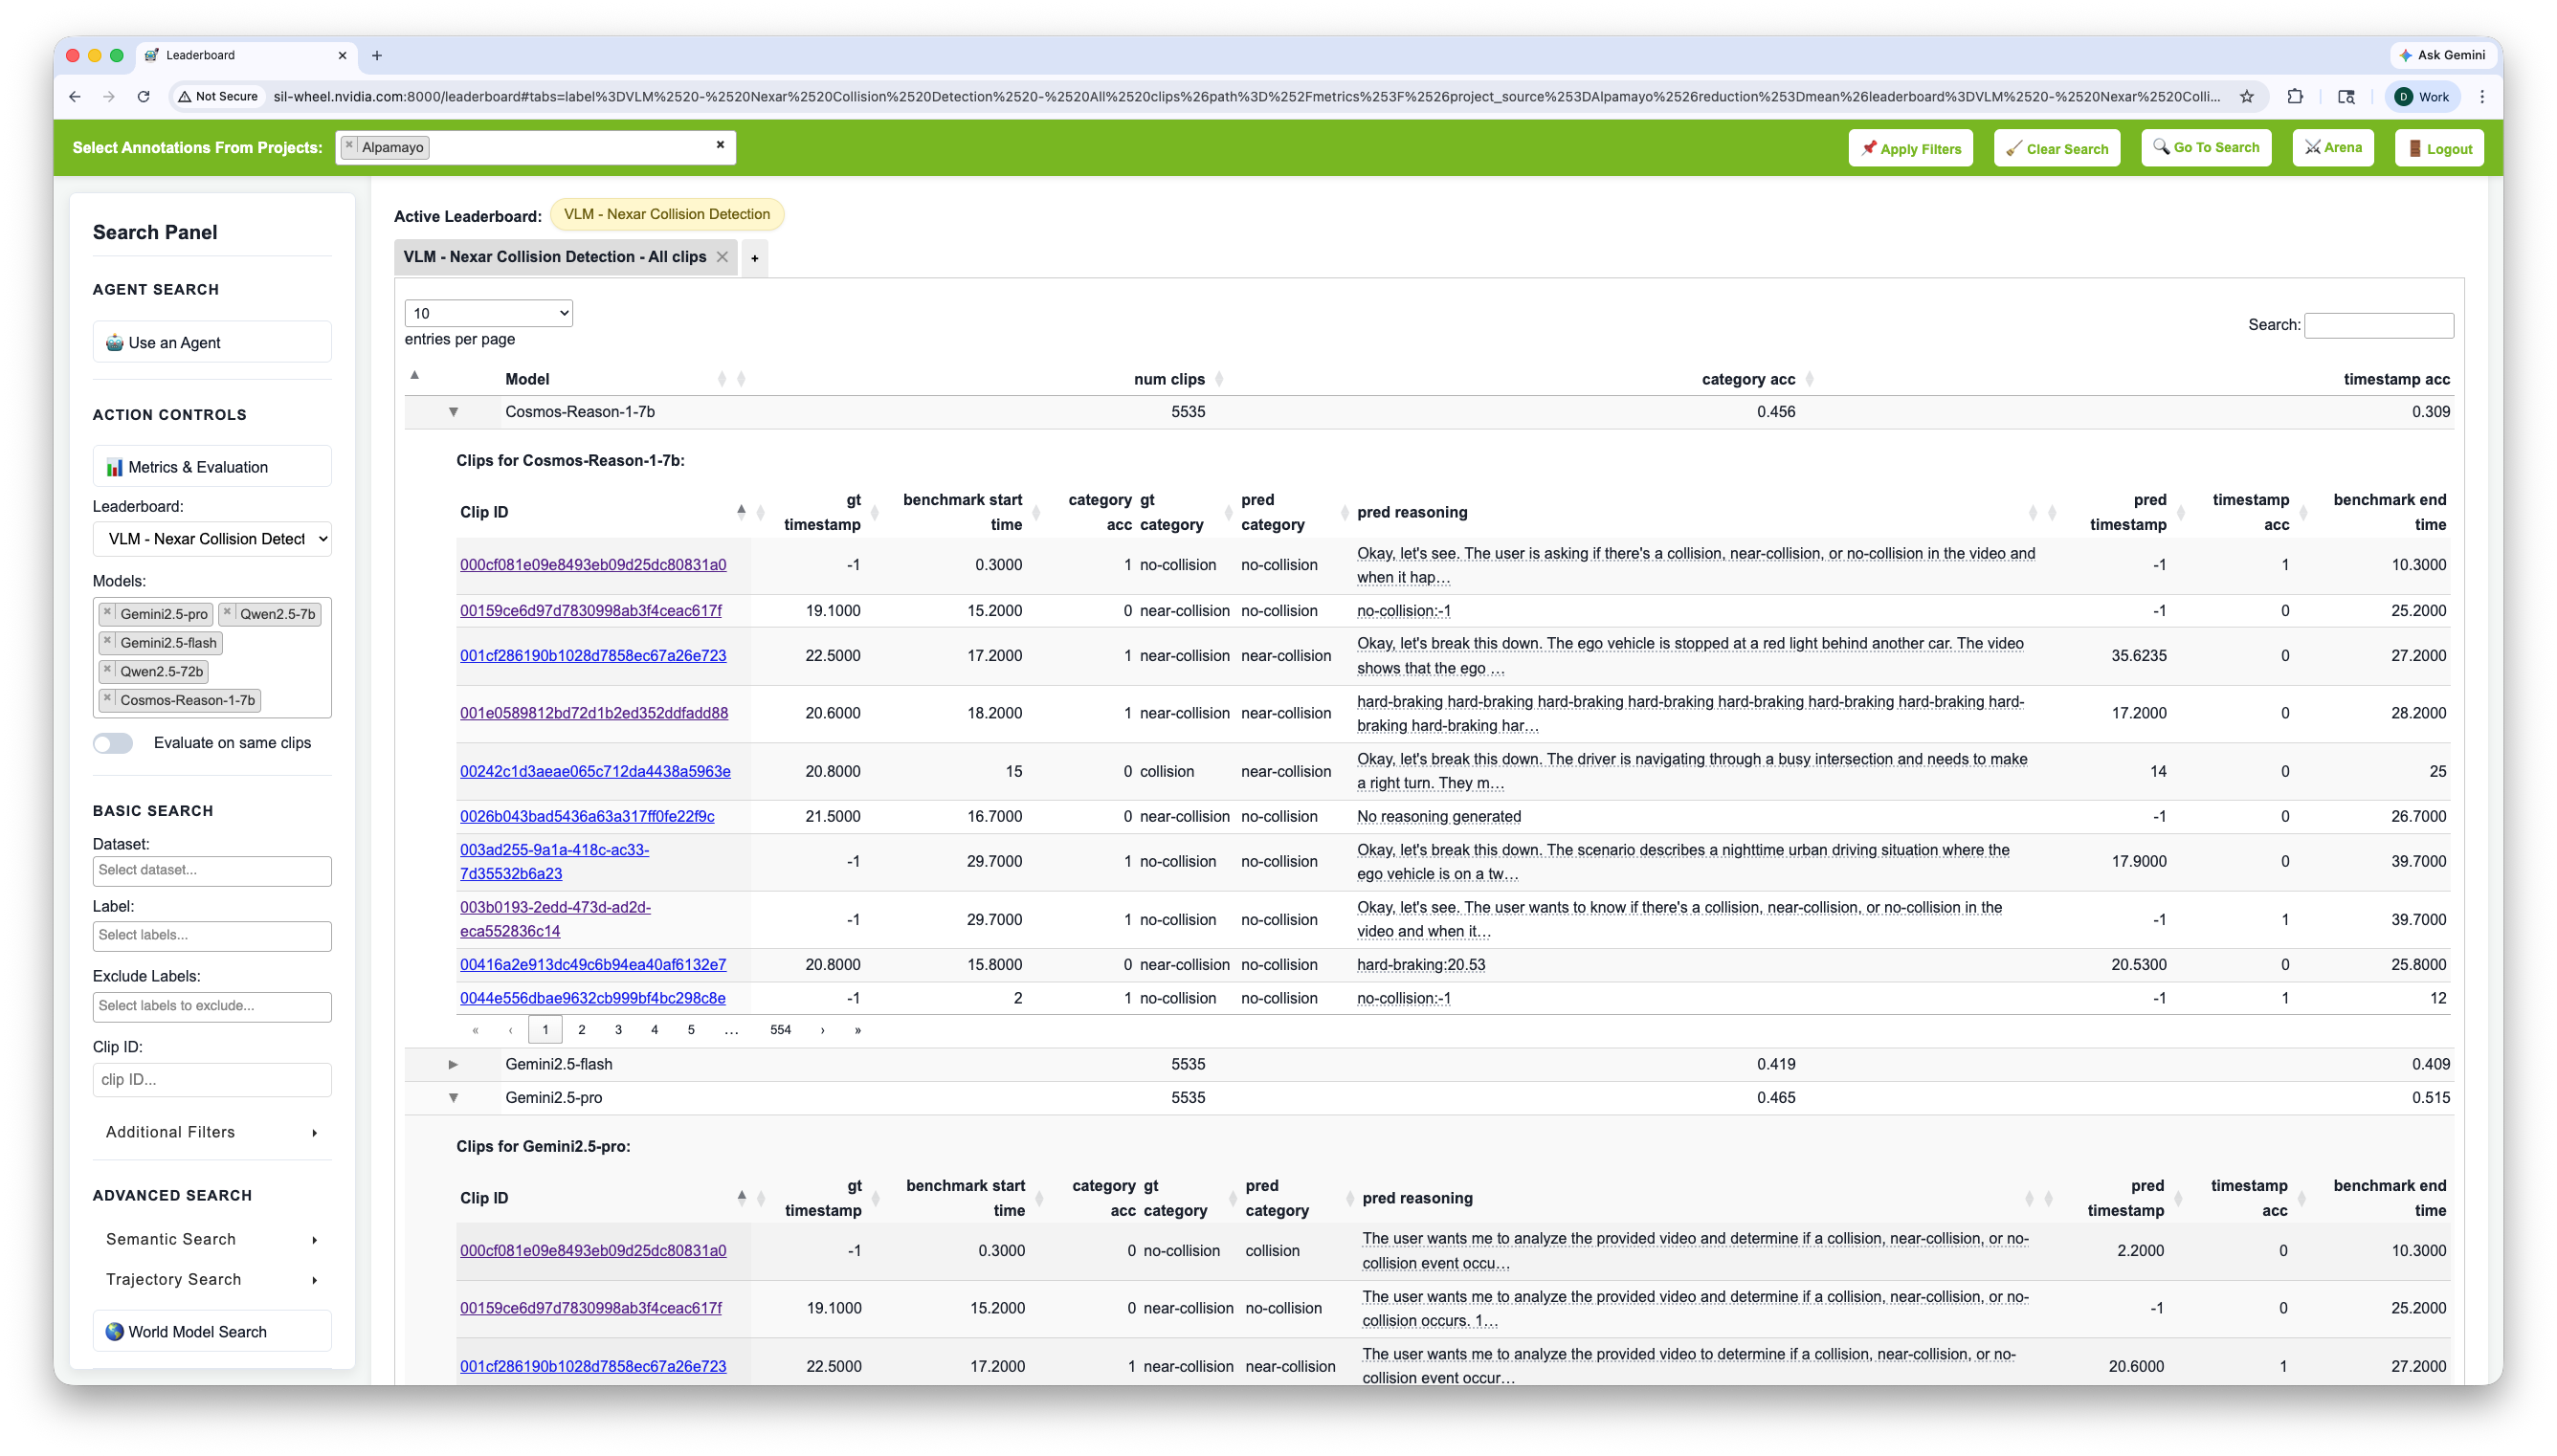
The VLM-Nexar Collision Detection Leaderboard showing per-model metrics on the full dataset.#
Changing the active search immediately recomputes rankings on the selected subset, making it possible to compare models on specific failure modes, geographic regions, driving scenarios, or any other searchable slice without changing the underlying predictions.
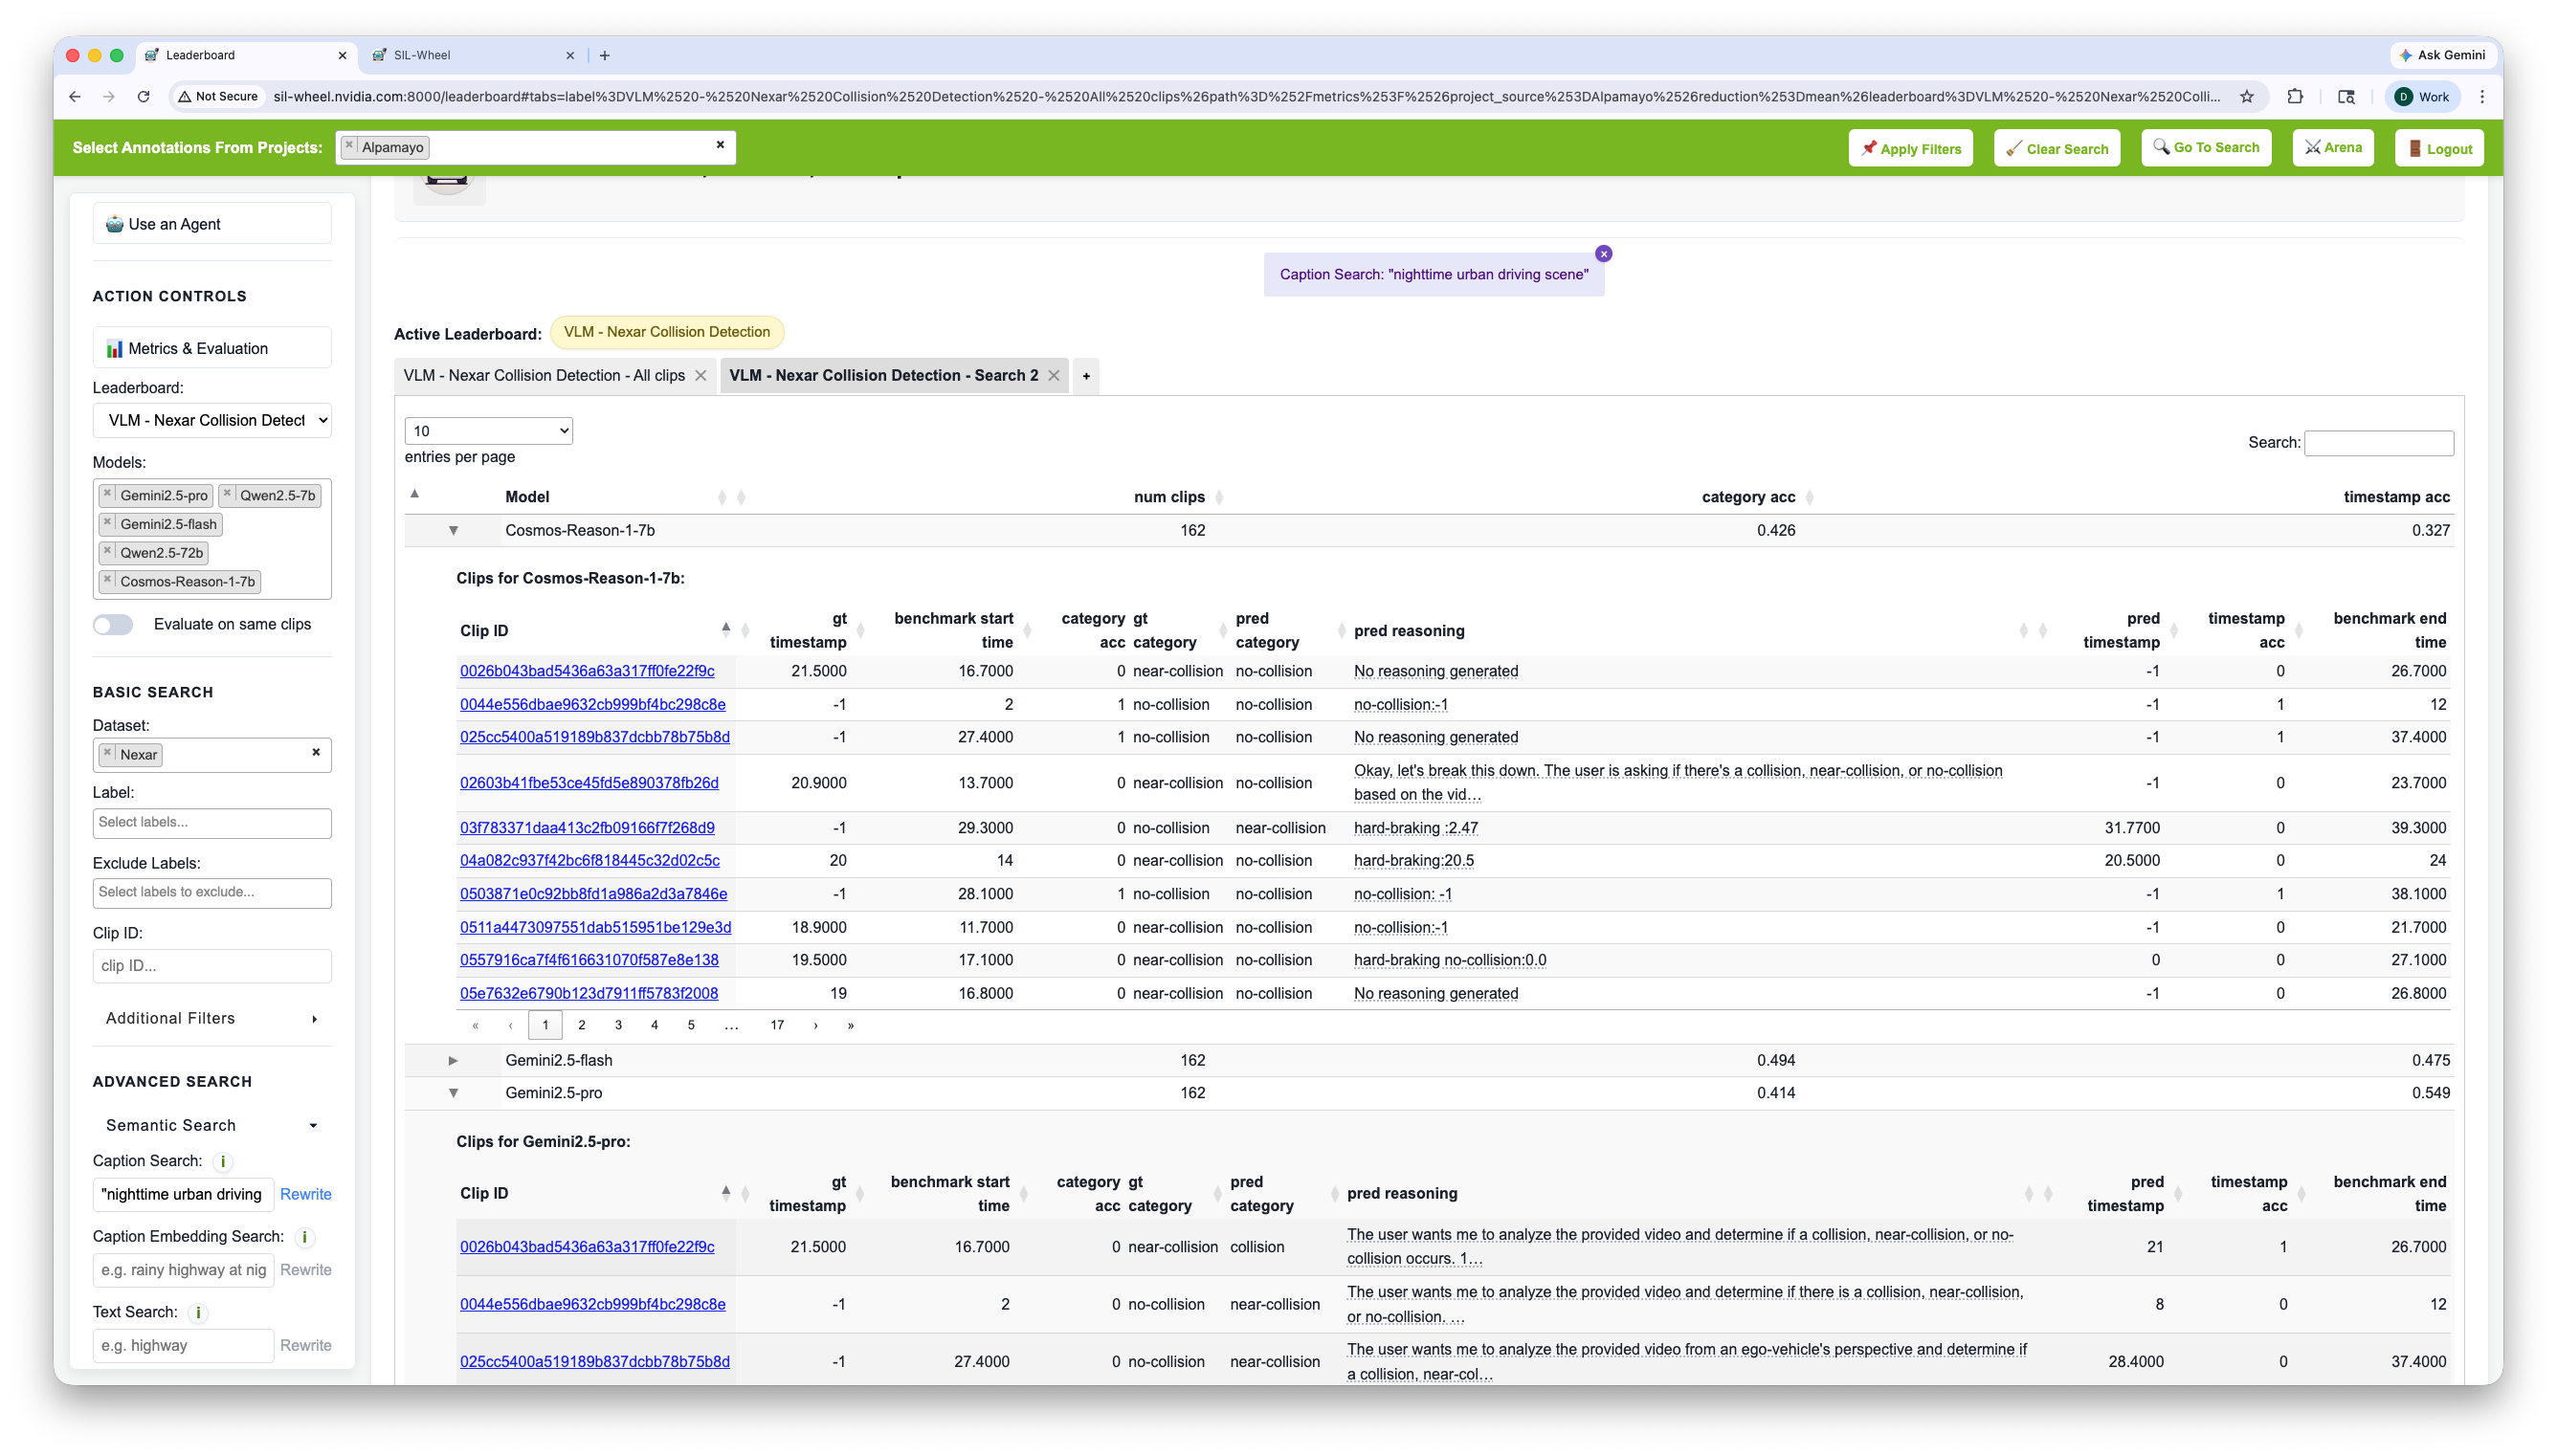
The VLM-Nexar Collision Detection Leaderboard on a slice of data retrieved with Caption Search for nighttime urban driving scene.#
How It Works#
Per-clip metrics are precomputed offline and loaded at server startup from the configured predictions directory. At query time, the server aggregates those metrics over the clips in the active slice and returns the result. No re-evaluation happens during search: all model outputs and scores are already stored on disk.
The leaderboard page mirrors the main search interface. The left panel exposes the same search controls, and any change to the query rerenders the table for the new slice.
Project-Specific Leaderboards#
Multiple leaderboard configurations can coexist and are selectable from the Leaderboard drop-down. Each leaderboard defines a different evaluation setup, including its own registered models, metrics, and prediction outputs.
For example, one leaderboard may evaluate ego-trajectory prediction models, while another evaluates VLM responses or generative model outputs. Although their contents differ, all leaderboards use the same slice-based workflow: the active search determines which clips are included in the evaluation. Switching between leaderboard groups results in different models and metrics specific to each evaluation setup.
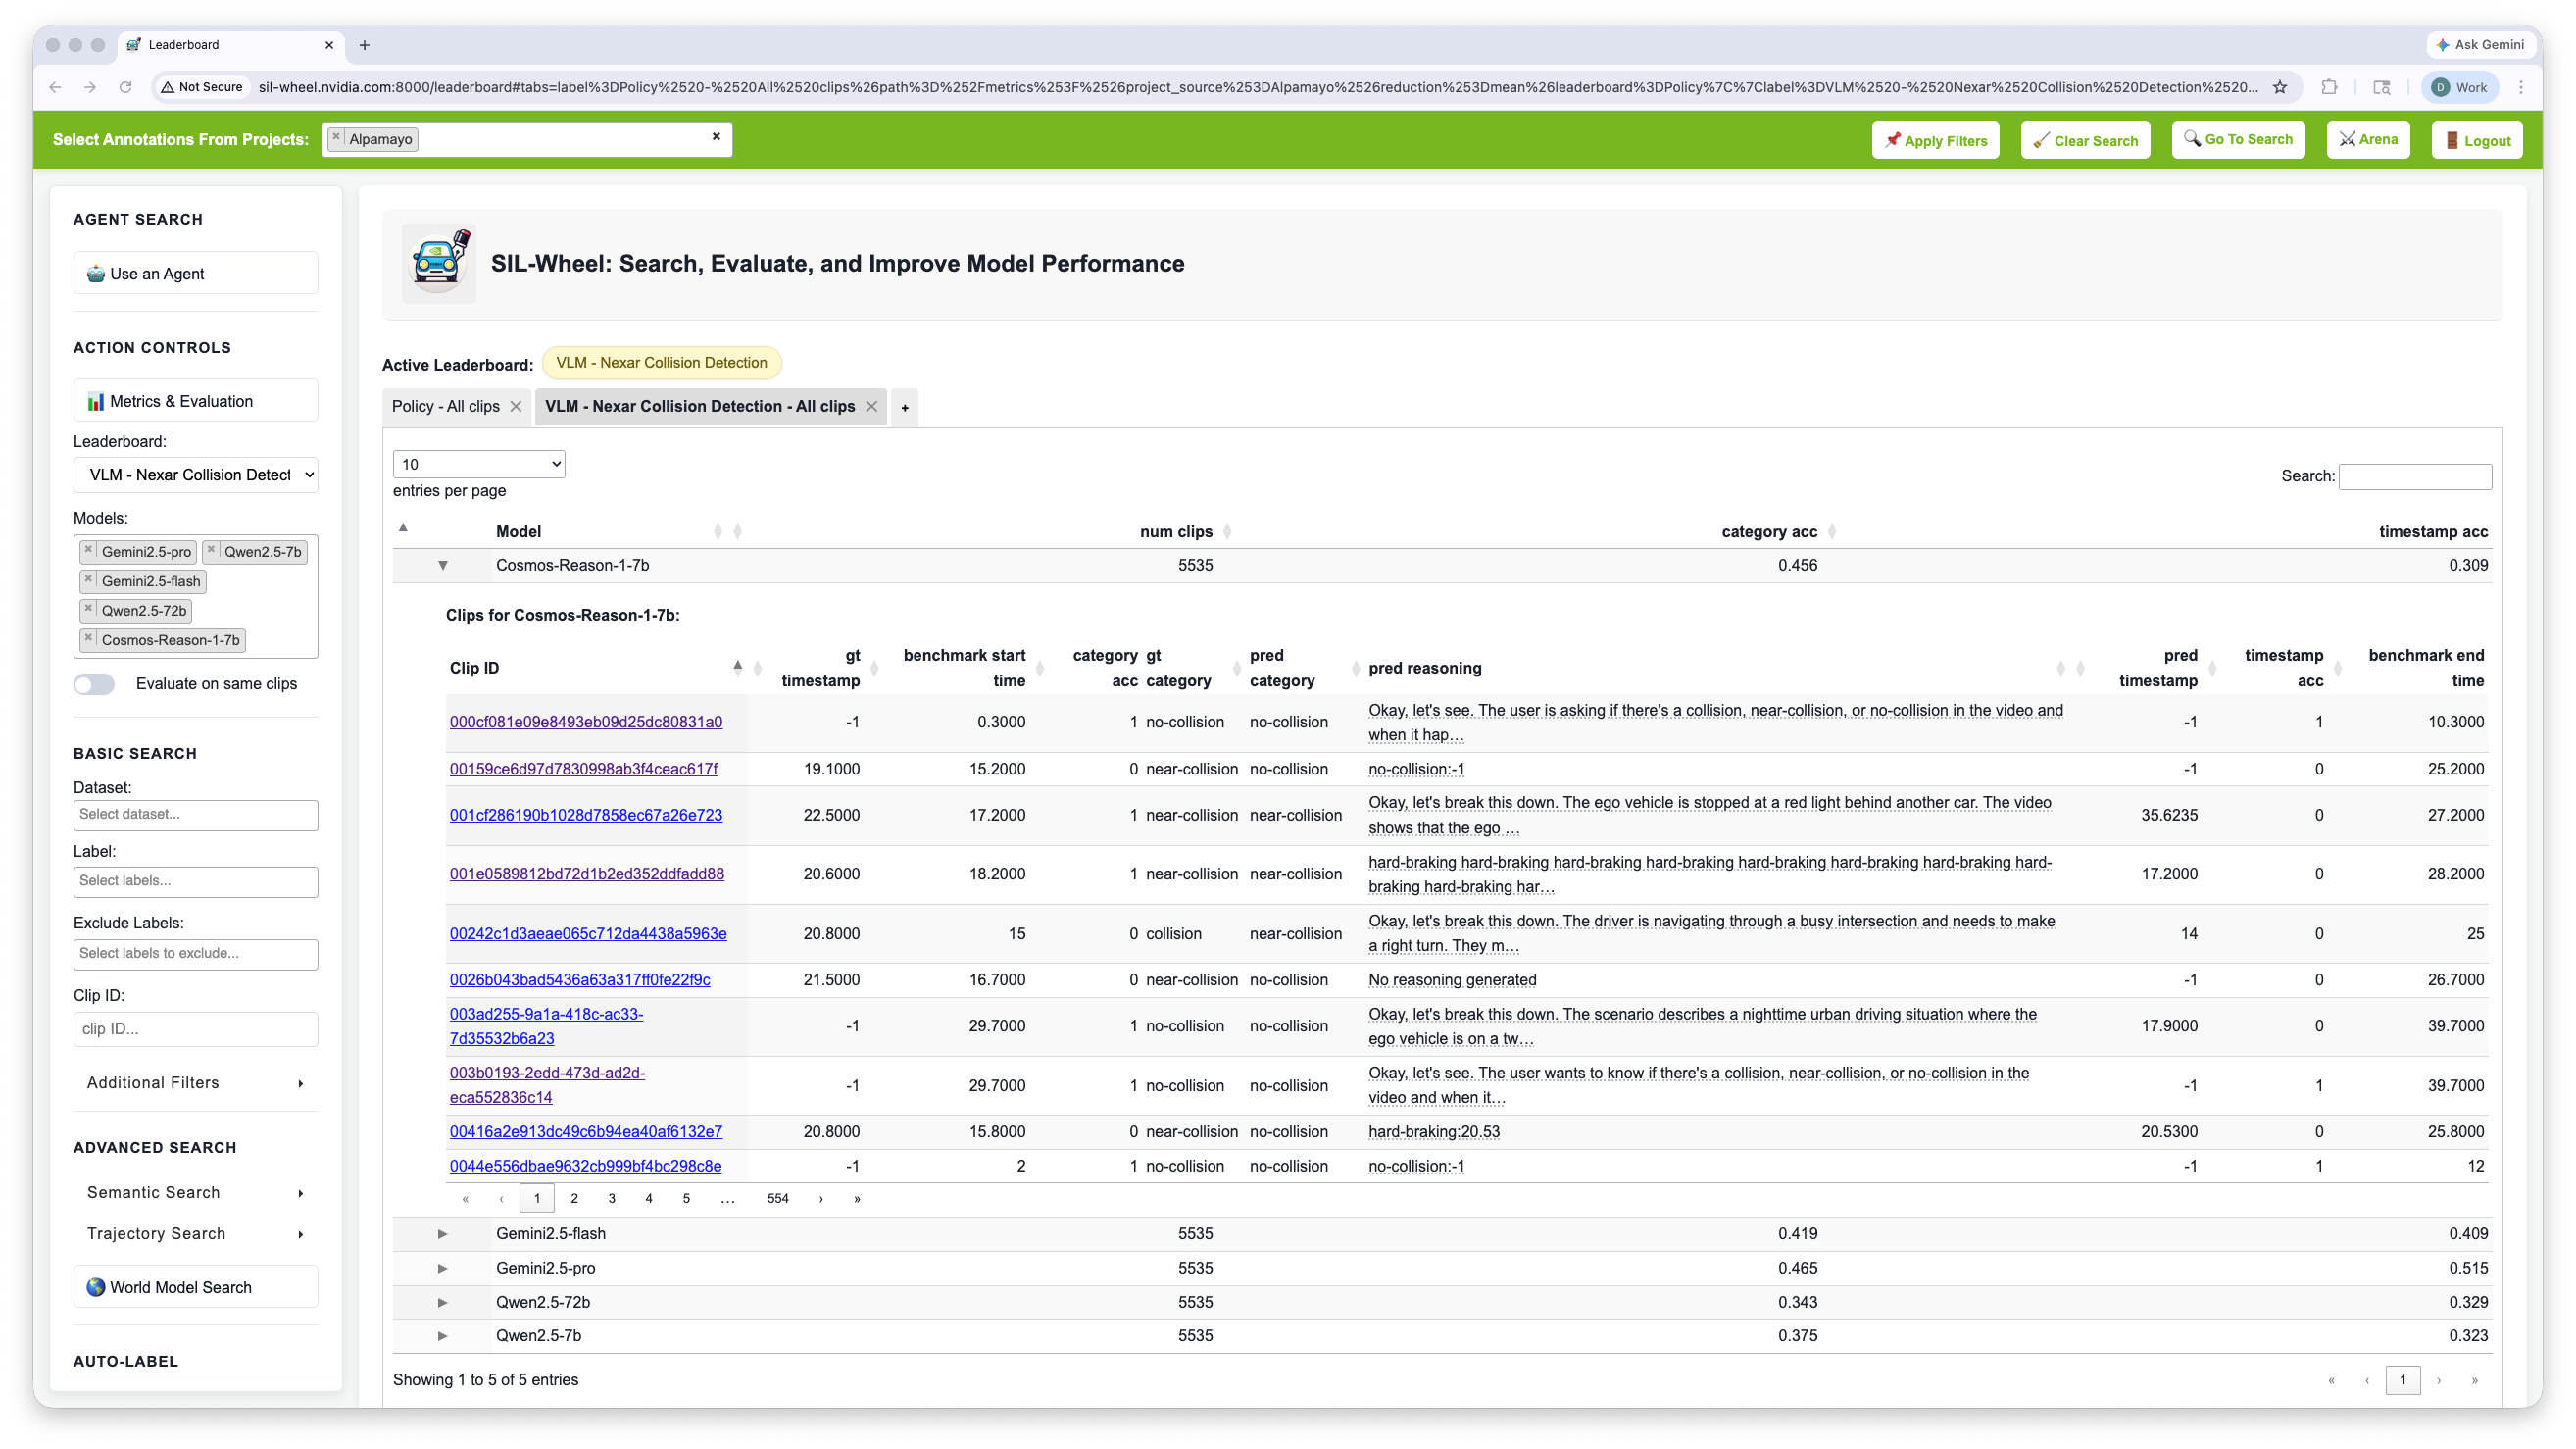
The VLM-Nexar Collision Detection leaderboard showing the specific models and metrics for this evaluation setup.#
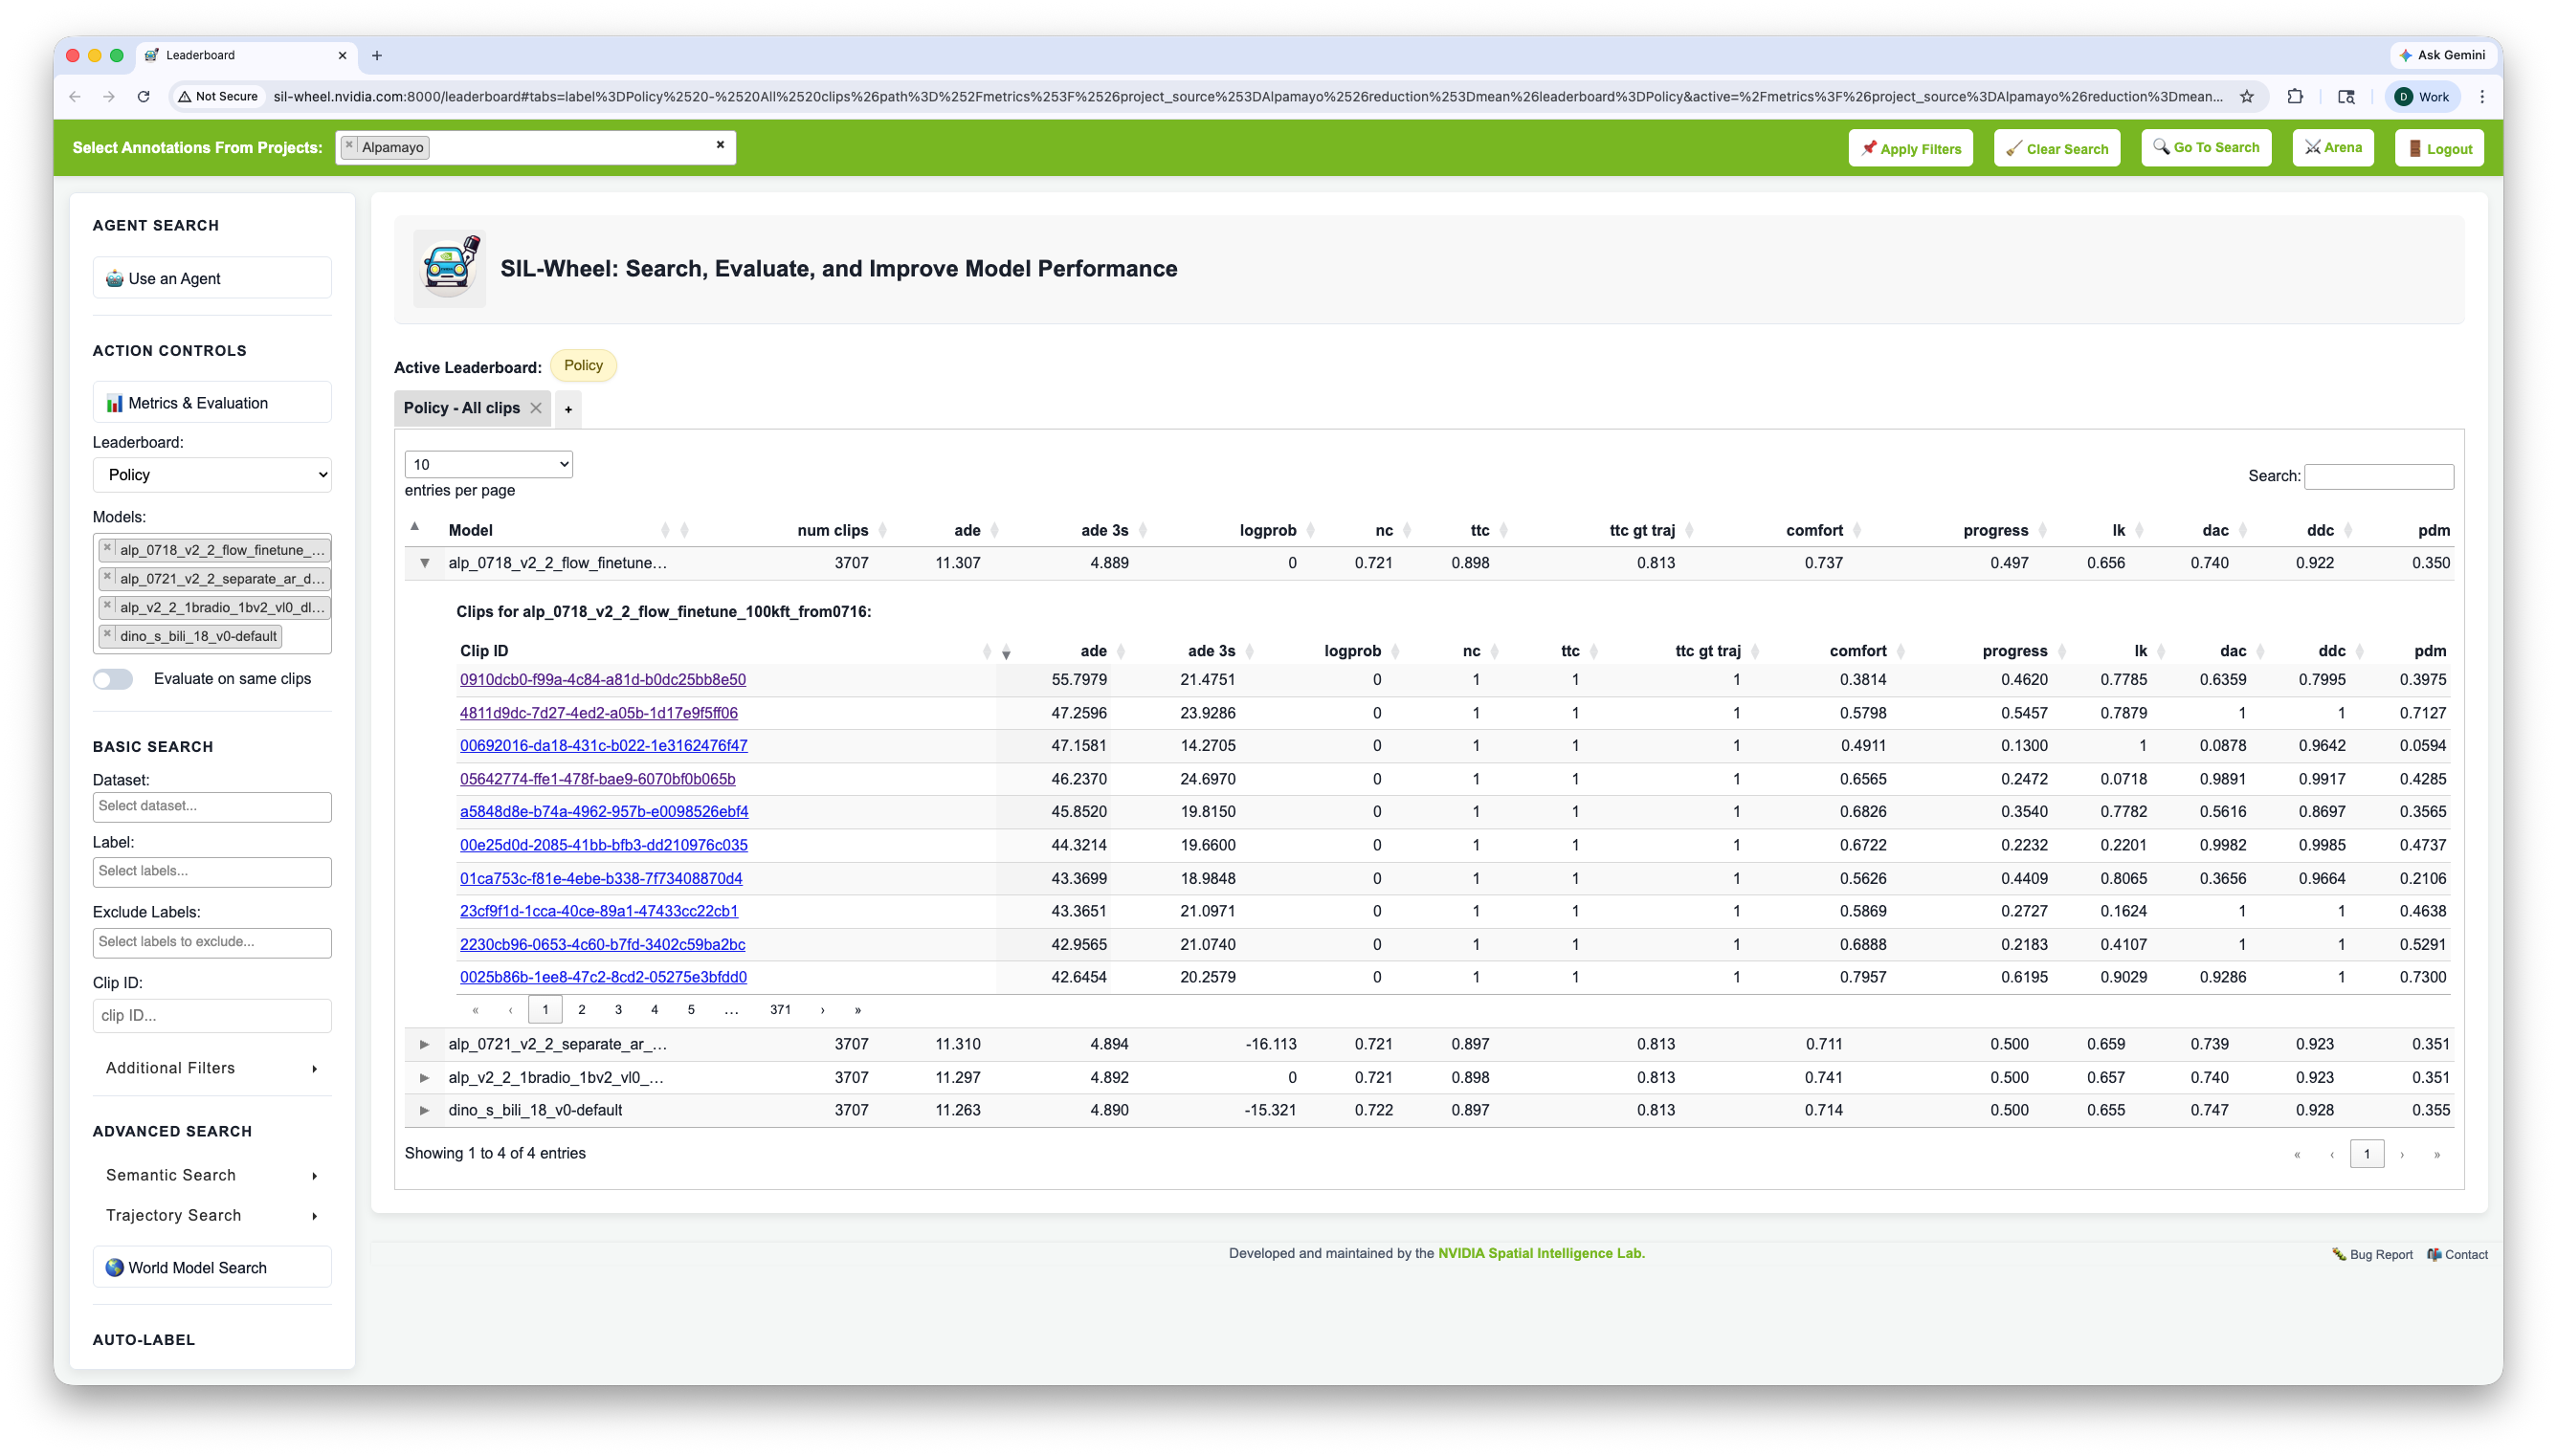
The Policy leaderboard showing ego-trajectory prediction metrics across registered driving models.#
Inspecting Results#
Within a leaderboard group, the Models multi-select filters the table to a subset of checkpoints or ablations without removing other entries from the group.
Expanding a model row opens a per-clip breakdown for the current slice, showing the individual metric values that contribute to the aggregate score. Depending on the leaderboard, this view may also expose project-specific outputs such as ego-trajectory predictions, VLM responses, or other model artifacts. Clicking a clip ID navigates directly to that clip in the main search interface.
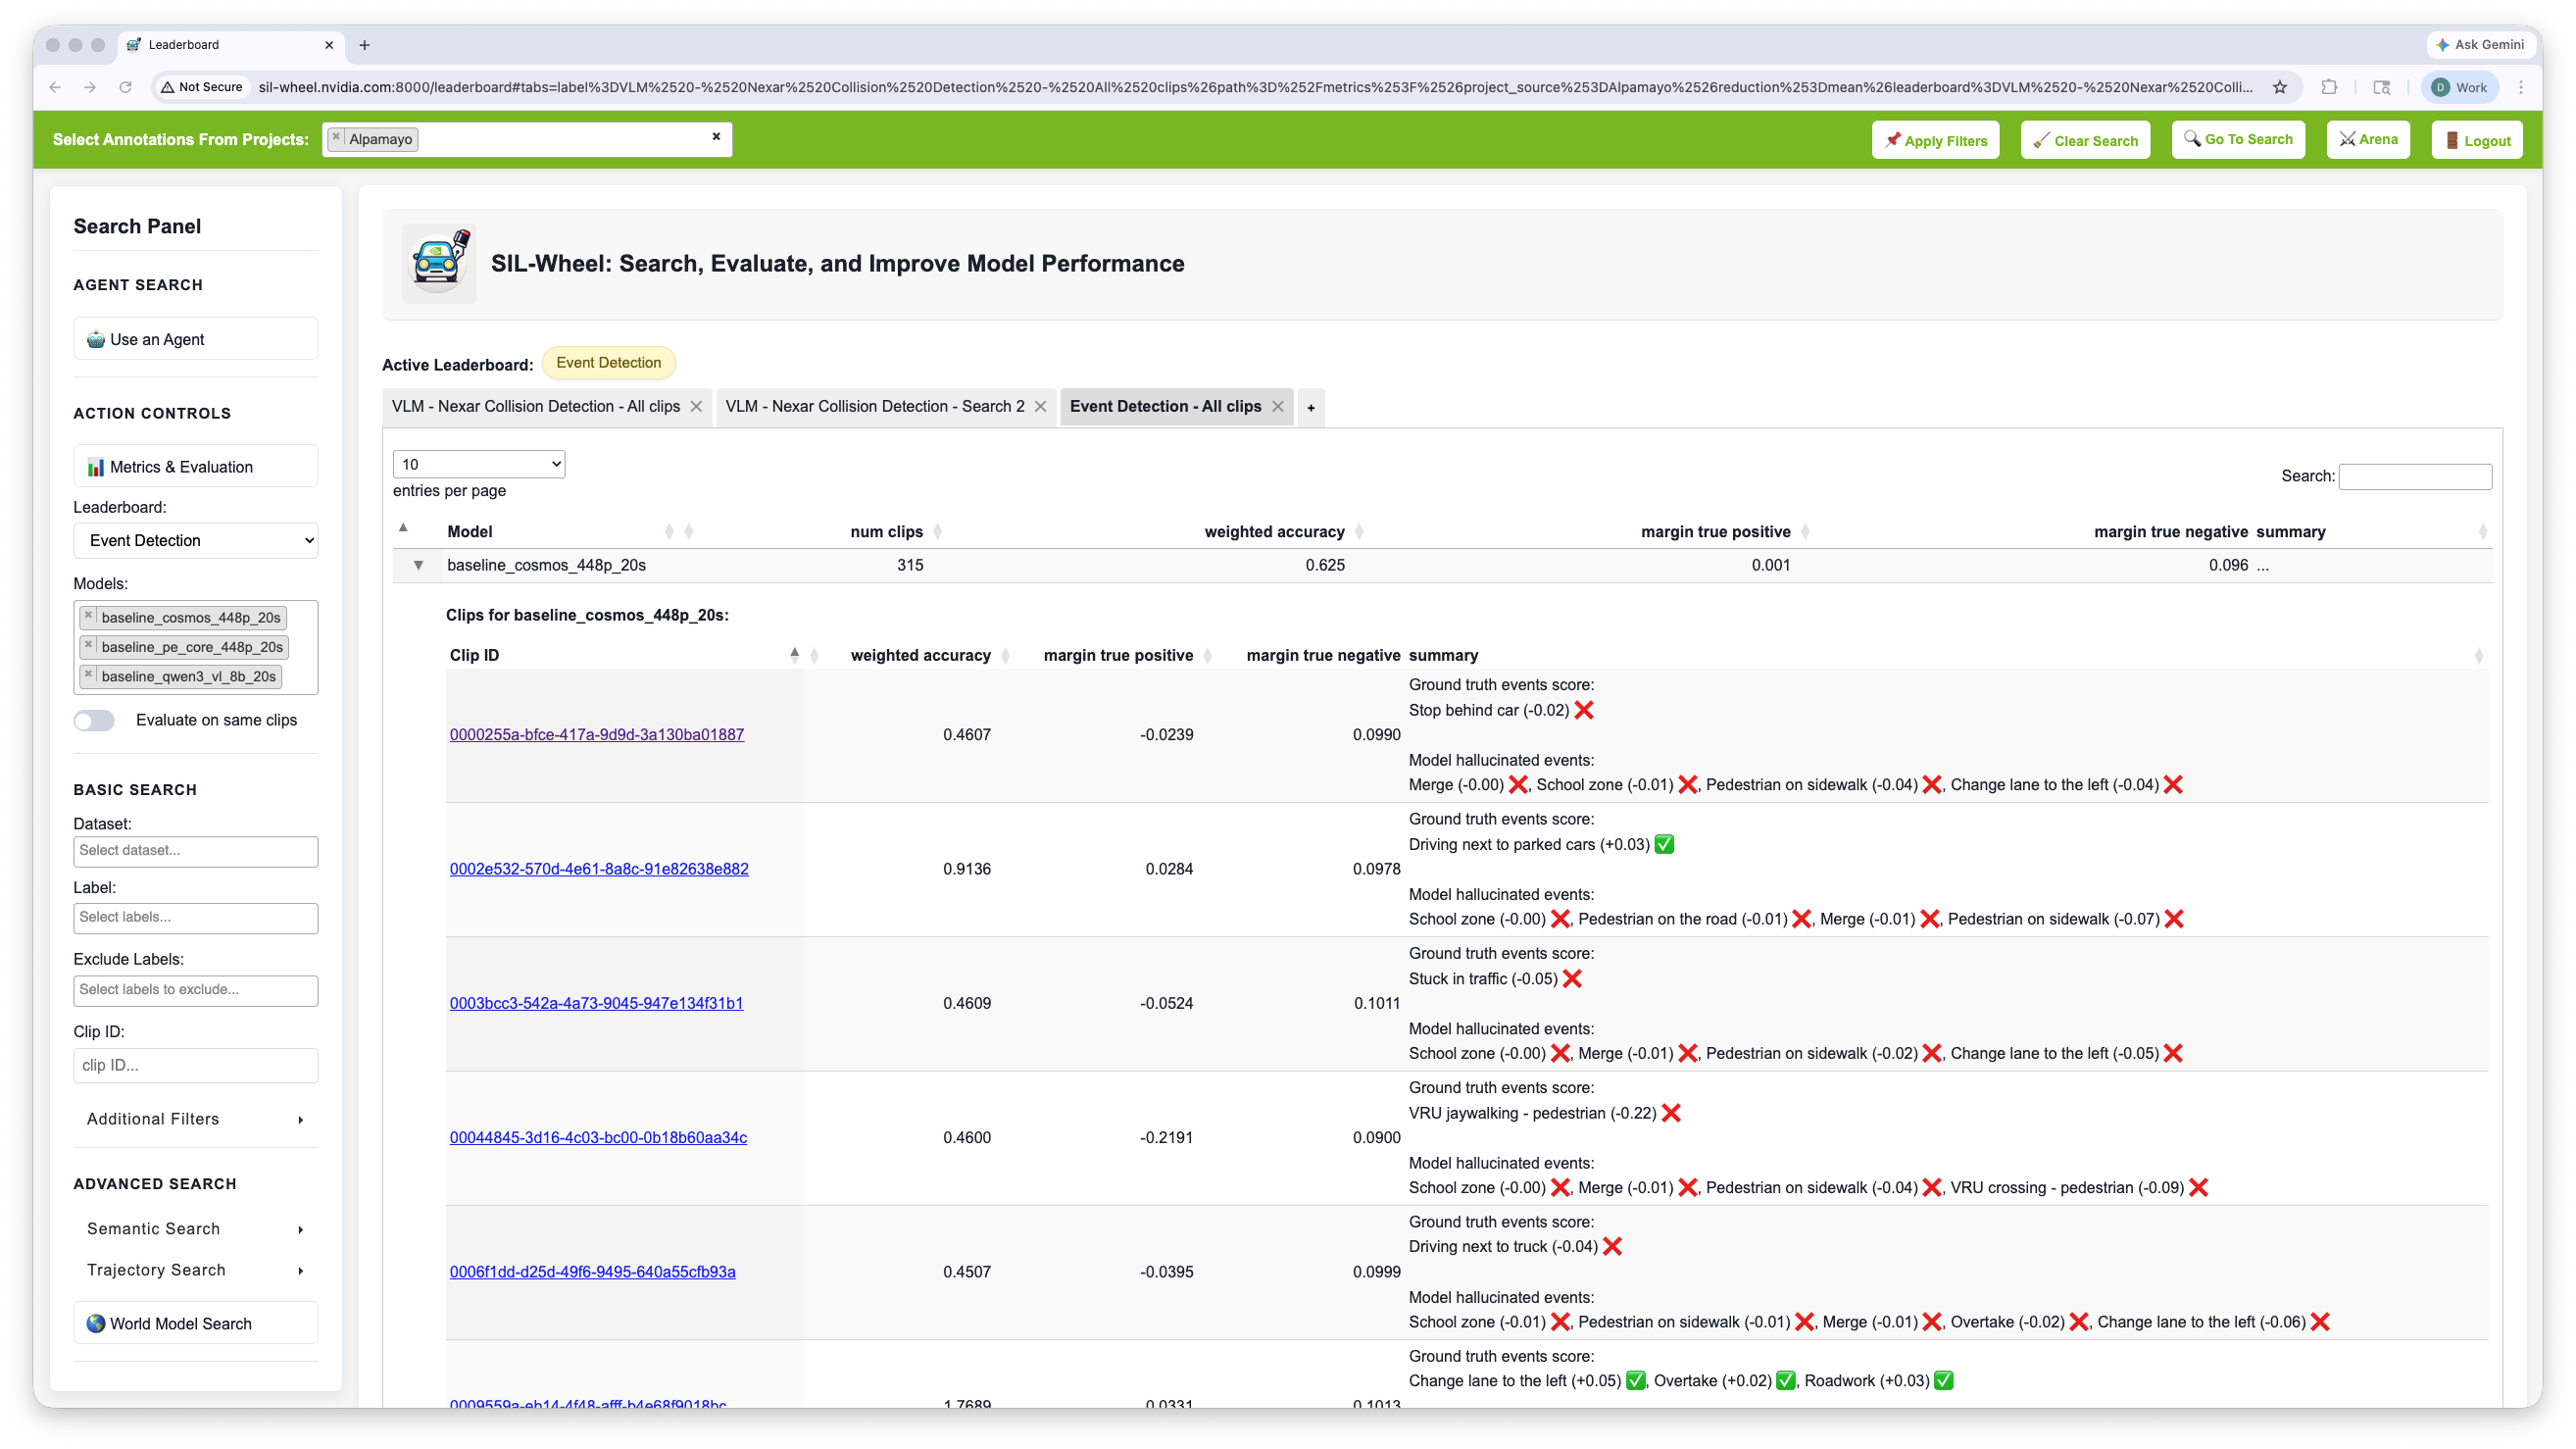
Per-clip metric breakdown for a selected model in the Event Detection Leaderboard.#
The leaderboard also supports metric-based filtering. Setting a minimum or maximum value on a metric restricts the clips under consideration to those whose score falls within that range, analogous to applying a numeric metric filter in the main search view.