
Model Predictions#
Evaluation tool: per-clip inspection of what each model actually output, side by side with ground truth.
The Model Predictions page shows per-clip model outputs alongside ground truth for detailed inspection of individual behaviours. What is shown depends on the leaderboard group: driving policy models show predicted and ground-truth ego trajectories in a top-down plot, while VLM or generative models show prompt responses or synthesised outputs. A metrics timeseries chart below the main view shows how per-clip scores evolve across the clips in the current slice, useful for spotting systematic patterns such as error spikes in a particular scenario type.
Reach for it when aggregate numbers have told you a model is weak somewhere and you need to see the specific failure: what it predicted, how that differed from ground truth, and whether the models fail in the same way.
Reach for something else when you are still looking for which clips are hard; Leaderboards surfaces those, and this page explains them.
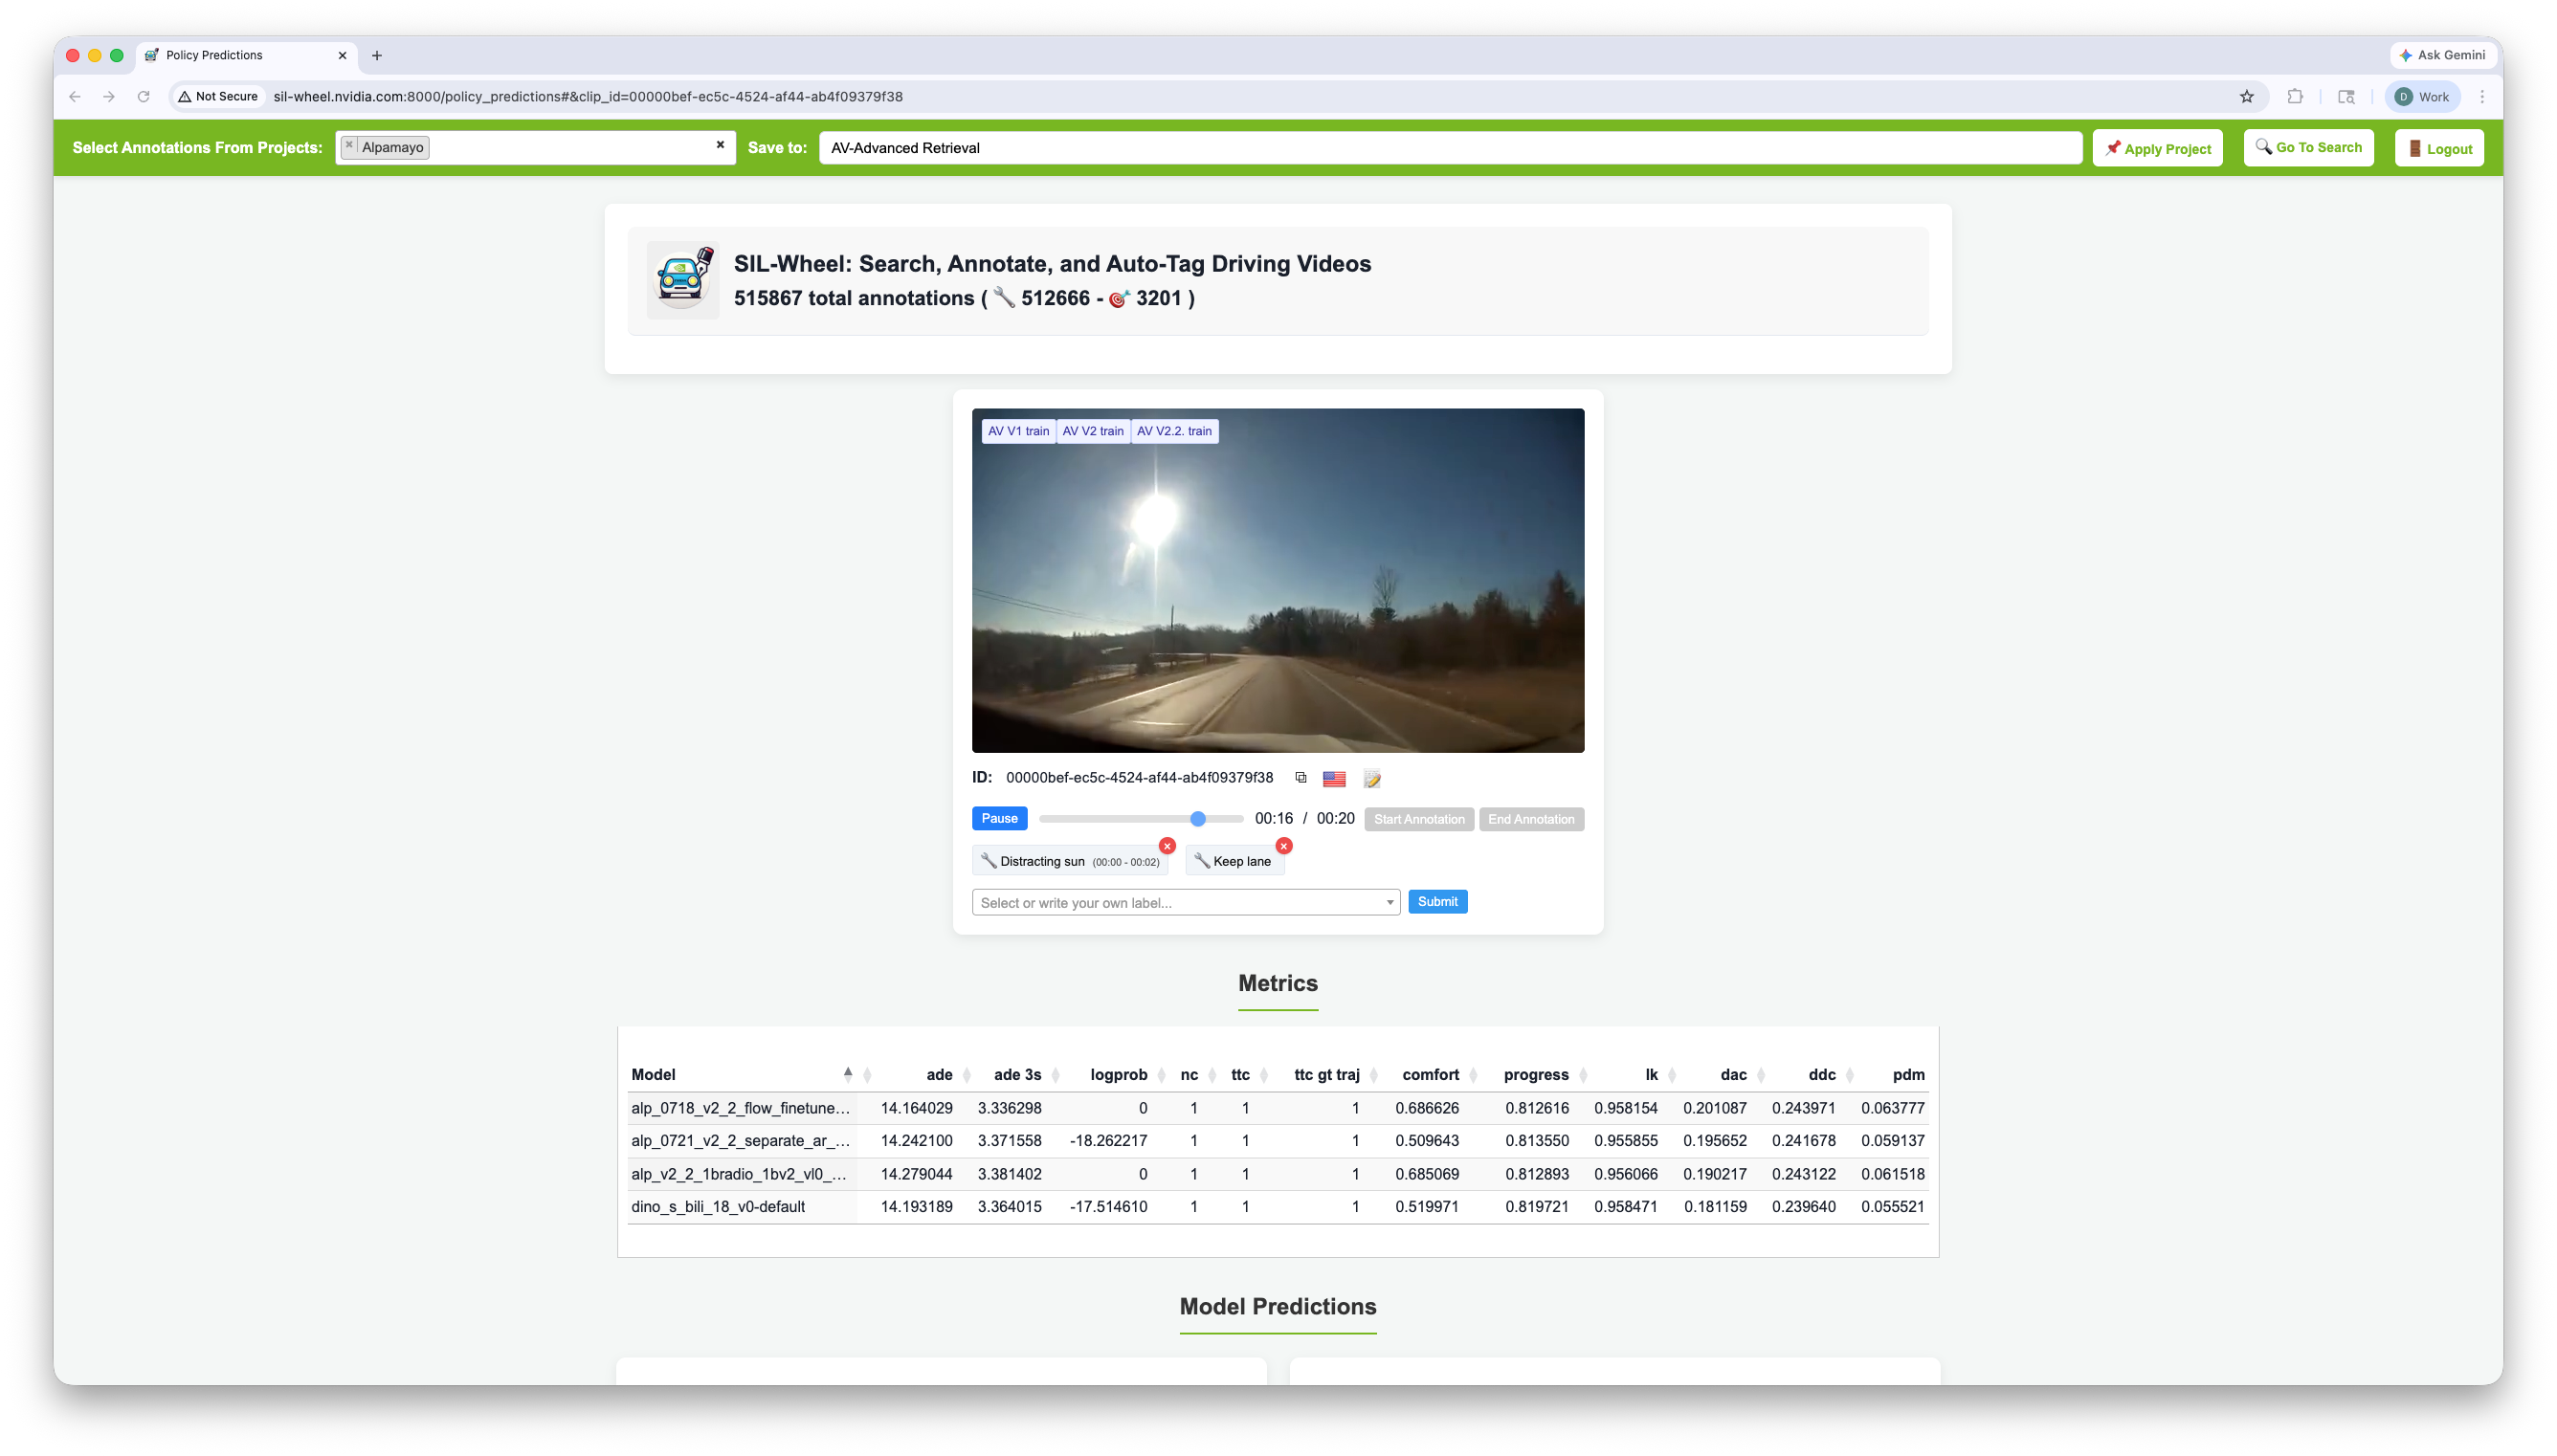
The Predictions page for the Policy Leaderboard, showing trajectory predictions from multiple models alongside ground truth for a selected clip.#
How It Works#
Predictions are precomputed offline and stored as NumPy arrays in the configured predictions directory. Clips are navigated directly by selecting them from the list on the left; the only filter available is the project source selector. For each selected clip the server loads the outputs for every registered model and returns them to the browser.
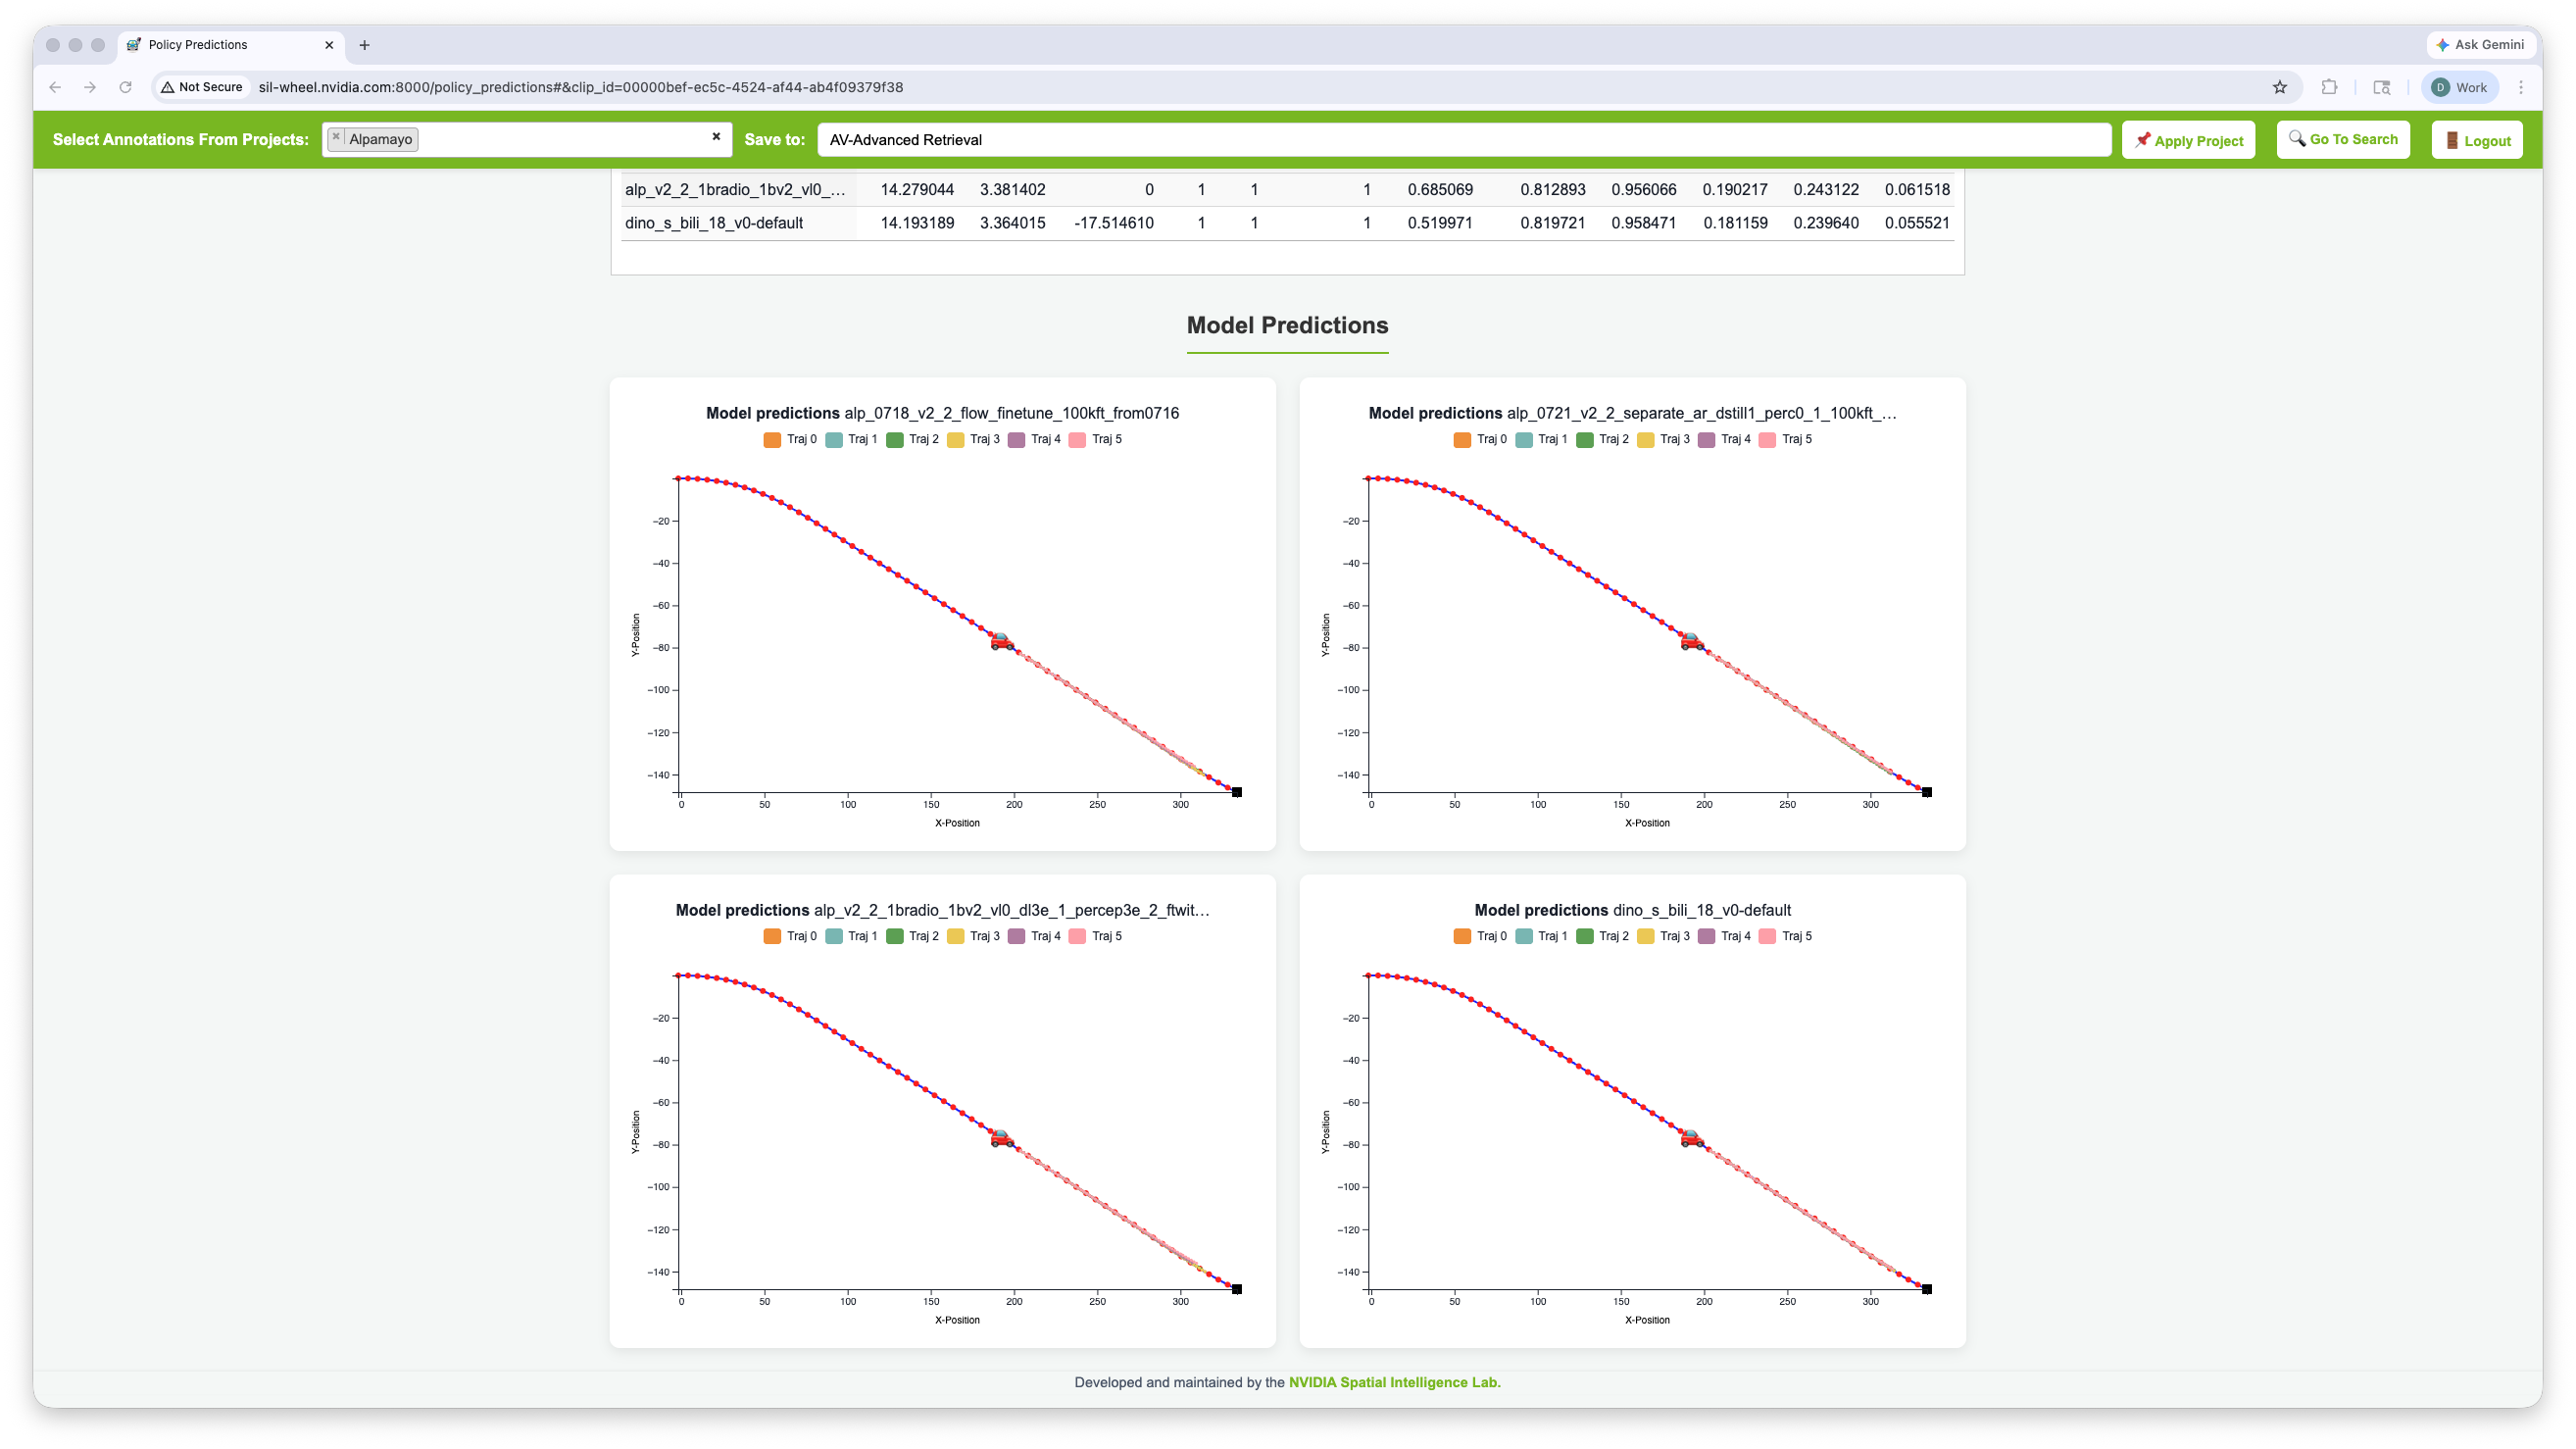
Predicted (coloured) and ground-truth (red) ego trajectories for all models on the same clip from the Policy Leaderboard.#
For VLM and generative leaderboards the view changes accordingly: instead of trajectory plots, each model’s text response or generated output is shown alongside the ground-truth label, making it straightforward to compare how different models interpret the same clip.
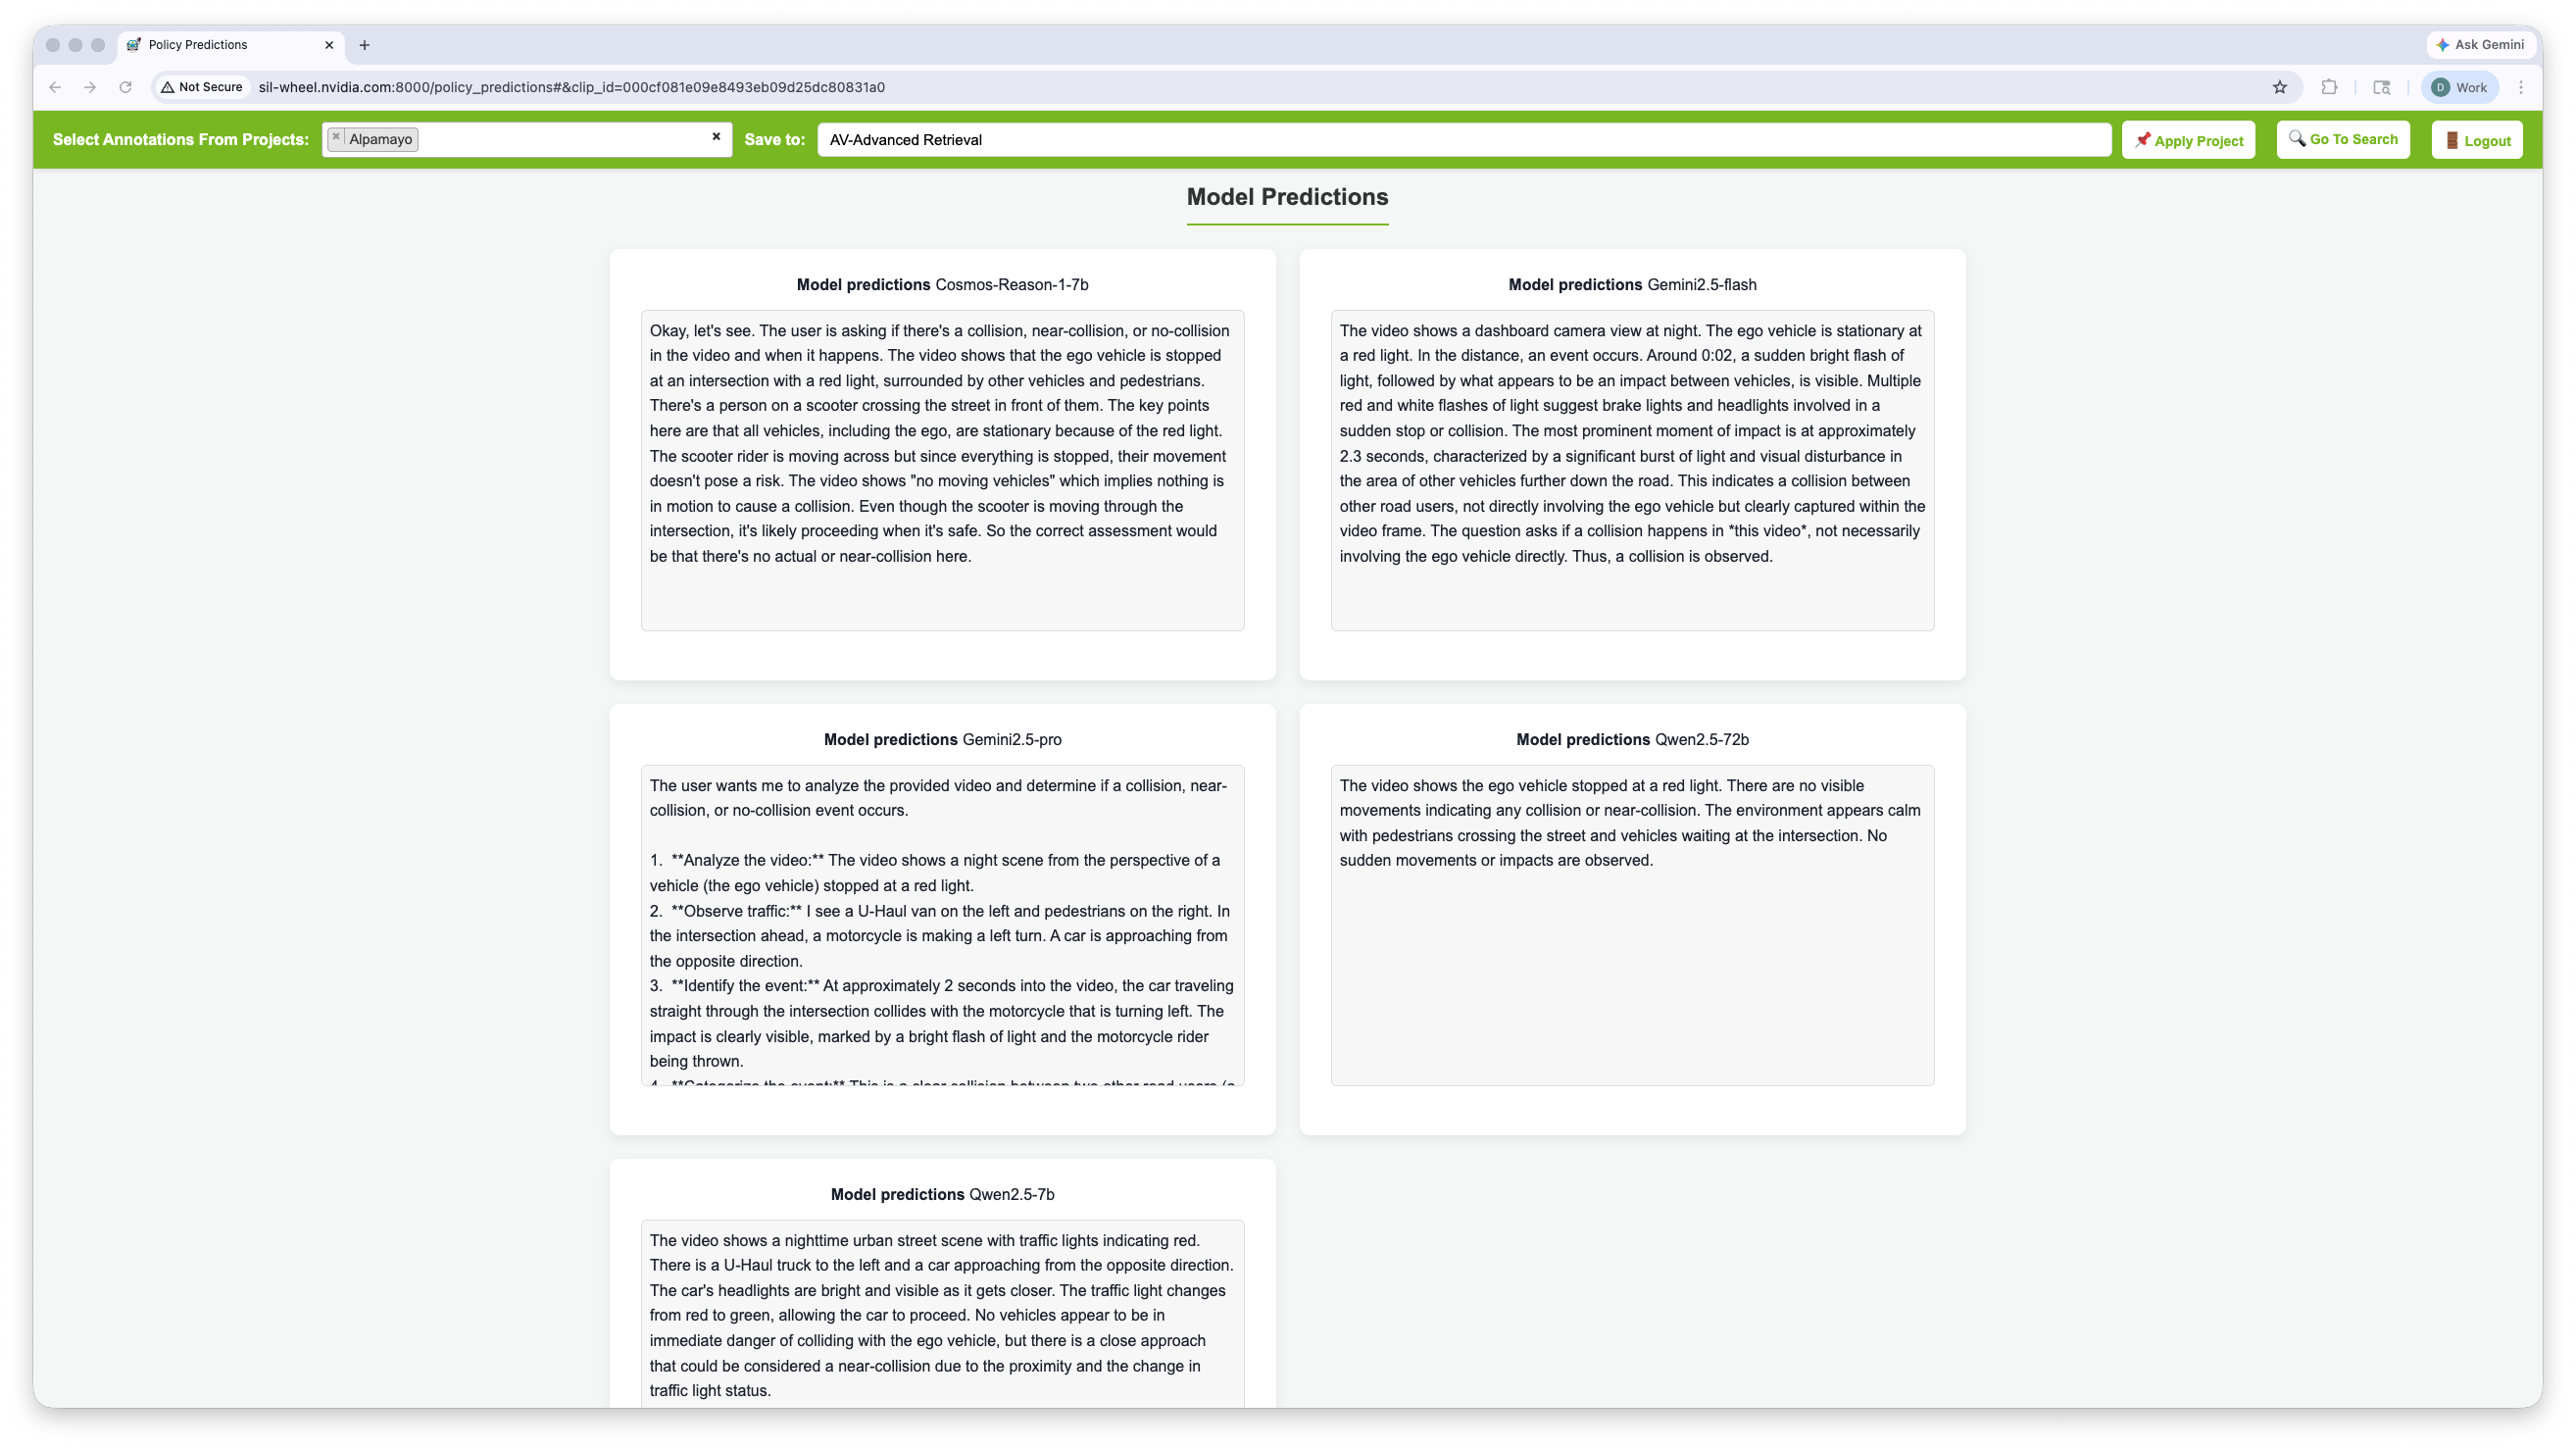
Model predictions for the VLM-Nexar Collision Detection leaderboard, showing per-clip model responses alongside ground-truth labels for a selected clip.#